Market Overview
The S&P 500 (SPY) closed down -0.39% at $708.45. while the Nasdaq 100 (QQQ) was down -0.56%. Among sector ETFs, XLE led (+0.78%) and XLK lagged (-1.42%). On the watchlist, AA was the biggest mover, falling -4.61%. No notable events were detected today. Today's dynamic watchlist added 5 trending tickers: NFLX, BMI, ALV, ALLY, AA (auto-discovered from high news activity and price movement).
No significant general news stories were detected today.
To put today's corporate activity in historical context, here is how watchlist stocks have reacted to similar events in the past. Based on 2 past earnings events, AA historically rose 1.39% on day 1 and was gaining 4.43% by day 5, with a 100% positive-outcome rate. Based on 100 past earnings events, AAPL historically rose 0.44% on day 1 and was gaining 2.05% by day 5, with a 56% positive-outcome rate. Based on 4 past earnings events, ALLY historically rose 2.07% on day 1 and was gaining 0.79% by day 5, with a 100% positive-outcome rate. Based on 6 past earnings events, ALV historically rose 2.05% on day 1 and was losing 2.31% by day 5, with a 100% positive-outcome rate. Based on 100 past earnings events, AMZN historically fell 0.03% on day 1 and was gaining 0.49% by day 5, with a 49% positive-outcome rate. Based on 1 past market movement events, BMI historically fell 1.84% on day 1 and was gaining 6.94% by day 5, with a 0% positive-outcome rate. Based on 100 past partnership events, GOOGL historically rose 0.30% on day 1 and was losing 0.04% by day 5, with a 59% positive-outcome rate. Based on 100 past other events, META historically fell 1.47% on day 1 and was losing 1.09% by day 5, with a 43% positive-outcome rate. Based on 100 past earnings events, MSFT historically fell 0.44% on day 1 and was losing 1.82% by day 5, with a 44% positive-outcome rate. Based on 7 past other events, NFLX historically fell 2.27% on day 1 and was losing 8.76% by day 5, with a 43% positive-outcome rate. Based on 100 past earnings events, NVDA historically fell 1.20% on day 1 and was losing 2.03% by day 5, with a 49% positive-outcome rate. Based on 100 past other events, TSLA historically fell 0.62% on day 1 and was losing 1.20% by day 5, with a 41% positive-outcome rate.
Stepping back to the broader market narrative, Social Grants and Consumer Spending was the most active theme with 2 mentions in the last 24 hours (velocity +1.0, bullish sentiment at +0.35), linked to CINT, BUR. IPO & Capital Markets had 1 mentions and is decelerating (velocity -1.0, sentiment +0.50) (AMZN). Market Sentiment Analysis had 1 mentions and is decelerating (velocity -1.0, sentiment +0.50) (AMZN). Market Movement Analysis had 1 mentions and is decelerating (velocity -1.0, sentiment -0.50).

Broad Market & Sector ETFs
| Ticker | Close | Change | Change% | Volume |
|---|---|---|---|---|
| QQQ | $651.42 | $3.69 | -0.56% | 37,080,000 |
| SPY | $708.45 | $2.76 | -0.39% | 52,293,495 |
| XLE | $56.98 | +$0.44 | +0.78% | 34,570,769 |
| XLF | $51.80 | $0.41 | -0.79% | 44,314,352 |
| XLK | $155.84 | $2.25 | -1.42% | 12,074,969 |
| XLV | $146.24 | $0.14 | -0.10% | 7,533,645 |

Watchlist Performance
| Ticker | Close | Change | Change% | Volume |
|---|---|---|---|---|
| AA | $65.37 | $3.16 | -4.61% | 3,540,593 |
| MSFT | $415.75 | $17.17 | -3.97% | 32,922,222 |
| TSLA | $373.72 | $13.79 | -3.56% | 93,126,220 |
| META | $659.15 | $15.57 | -2.31% | 11,552,432 |
| ALLY | $45.02 | $0.70 | -1.53% | 2,558,427 |
| NVDA | $199.64 | $2.86 | -1.41% | 108,937,228 |
| BMI | $123.00 | $0.56 | -0.45% | 727,028 |
| NFLX | $92.82 | $0.42 | -0.45% | 37,485,455 |
| GOOGL | $338.89 | $0.43 | -0.13% | 18,458,741 |
| ALV | $116.31 | +$0.14 | +0.12% | 806,635 |
| AMZN | $255.08 | $0.28 | -0.11% | 31,032,997 |
| AAPL | $273.43 | +$0.26 | +0.10% | 24,818,646 |

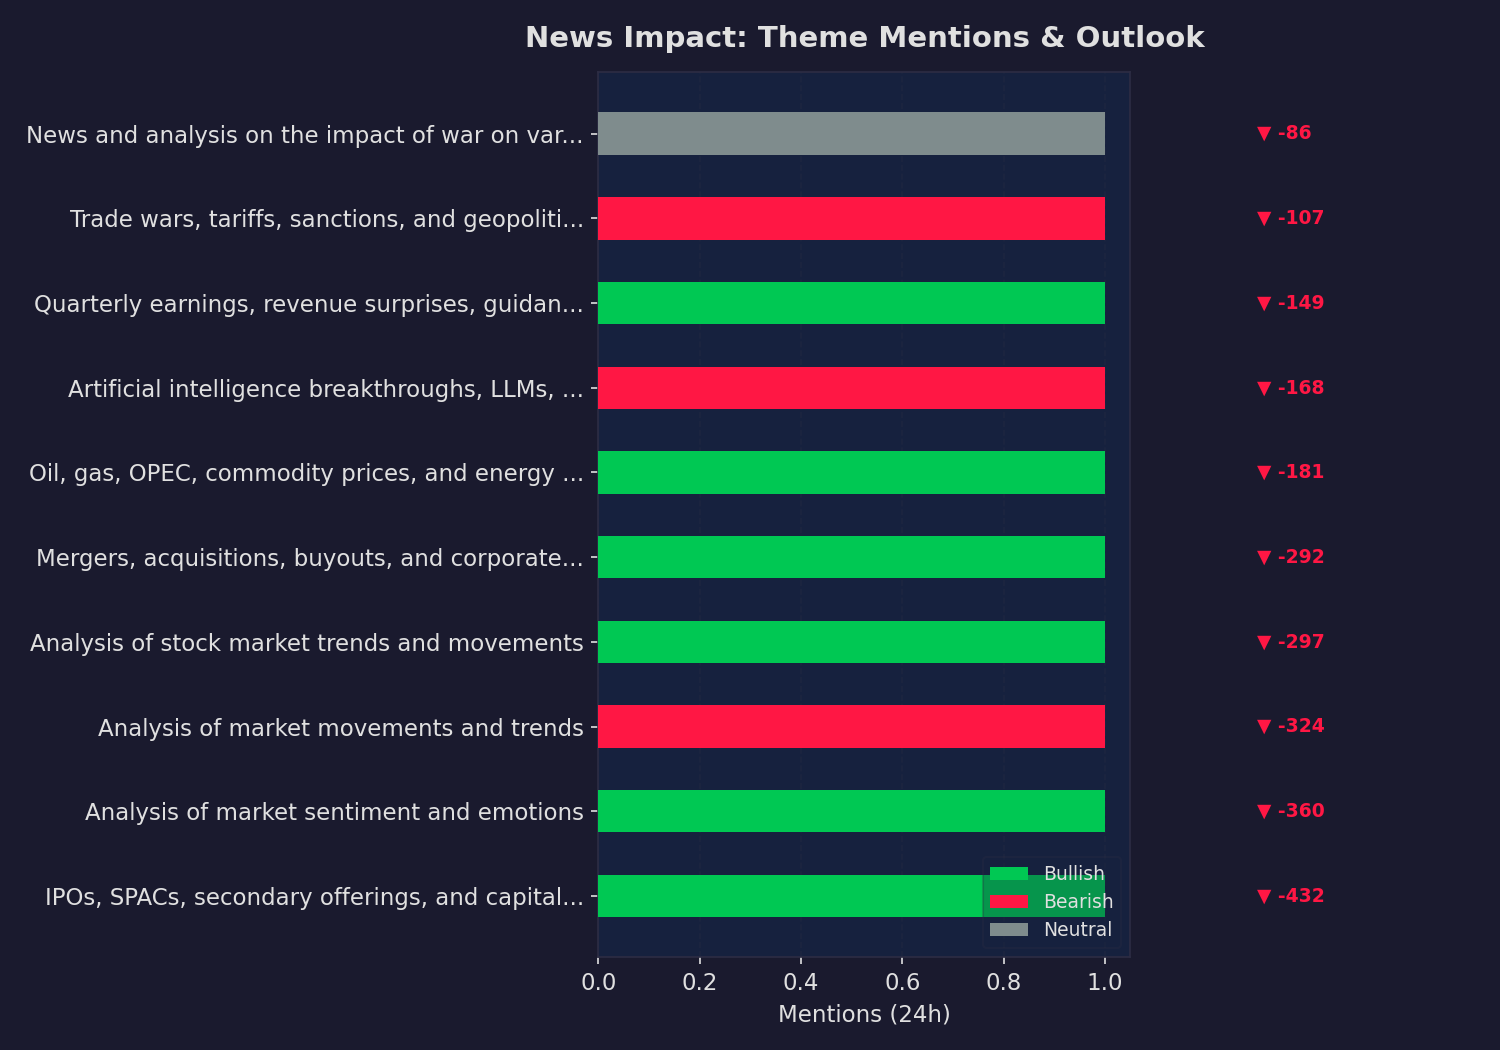
News Impact Classification
Today’s snapshot. Mentions = articles matched in the last 24 hours. Momentum = change vs. the previous 24-hour period.
Supporting Sources
- Most U.S. farmers can’t afford all the fertilizer they need this year. Opening the Strait of Hormuz… (MarketWatch Top Stories)
- Most U.S. farmers can’t afford all the fertilizer they need this year. Opening the Strait of Hormuz… (MarketWatch Top Stories)
- Most U.S. farmers can’t afford all the fertilizer they need this year. Opening the Strait of Hormuz… (MarketWatch Top Stories)
Theme History
Long-term theme baselines. Activity shows how the last 30 days of mentions compare to the historical monthly average — e.g. 2.5x means 2.5 times more mentions than usual. Tracked since 2006-03-20 (241 months of data).
| Theme | Total | Avg/Mo | Last 30d | Activity | Sentiment | Peak |
|---|---|---|---|---|---|---|
| Family Financial Planning | 4,261 | 25.1 | 1987 | ▲▲ 79.2x | Neutral | 2026-03 |
| Geopolitical Risk Assessment | 2,978 | 24.0 | 1897 | ▲▲ 79.0x | Neutral | 2026-04 |
| Energy & Commodities | 16,020 | 83.9 | 5724 | ▲▲ 68.2x | Bullish | 2026-03 |
| Mergers & Acquisitions | 40,922 | 170.5 | 11190 | ▲▲ 65.6x | Bullish | 2026-03 |
| Consumer Spending & Retail | 2,545 | 15.2 | 863 | ▲▲ 56.8x | Neutral | 2026-03 |
| Presidential Financial News | 4,897 | 28.3 | 1552 | ▲▲ 54.8x | Neutral | 2026-03 |
| Geopolitical & Trade Tensions | 12,968 | 63.9 | 3344 | ▲▲ 52.3x | Bullish | 2026-03 |
| Tax Refund Issues | 1,768 | 11.3 | 569 | ▲▲ 50.4x | Neutral | 2026-03 |
| Market Sentiment Analysis | 67,268 | 279.1 | 14027 | ▲▲ 50.3x | Bullish | 2026-03 |
| Regulatory Risk Management | 3,163 | 19.3 | 957 | ▲▲ 49.6x | Bearish | 2026-03 |
| IPO & Capital Markets | 83,945 | 348.3 | 16504 | ▲▲ 47.4x | Bullish | 2026-03 |
| Crypto & Digital Assets | 3,737 | 27.1 | 1265 | ▲▲ 46.7x | Neutral | 2026-03 |
| Market Movement Analysis | 62,487 | 261.5 | 12191 | ▲▲ 46.6x | Neutral | 2026-03 |
| War Impact on Industry | 15,052 | 68.4 | 3142 | ▲▲ 45.9x | Neutral | 2026-03 |
| AI & Technology Innovation | 28,844 | 139.3 | 6213 | ▲▲ 44.6x | Bullish | 2026-03 |
| Earnings Season & Corporate Results | 24,319 | 118.1 | 5104 | ▲▲ 43.2x | Bullish | 2026-03 |
| Stock Market Analysis | 68,076 | 286.0 | 11569 | ▲▲ 40.5x | Bullish | 2026-03 |
| Sector Rotation | 13,188 | 62.8 | 2441 | ▲▲ 38.9x | Bullish | 2026-03 |
| Social Media Rebranding | 5,777 | 28.6 | 1050 | ▲▲ 36.7x | Neutral | 2026-03 |
| Labor Market & Employment | 6,382 | 50.7 | 1829 | ▲▲ 36.1x | Neutral | 2026-03 |
| Short Selling Strategies | 2,024 | 16.3 | 508 | ▲▲ 31.2x | Bullish | 2026-03 |
| Social Media Buzz | 20,676 | 89.9 | 2710 | ▲▲ 30.1x | Bullish | 2026-03 |
| Regulatory & Antitrust | 11,452 | 60.9 | 1749 | ▲▲ 28.7x | Neutral | 2026-03 |
| Tax Planning Strategy | 482 | 9.5 | 218 | ▲▲ 22.9x | Neutral | 2026-03 |
| Federal Reserve & Interest Rates | 7,029 | 38.6 | 737 | ▲▲ 19.1x | Neutral | 2026-03 |
| Apple Financial News | 6,397 | 33.8 | 508 | ▲▲ 15.0x | Bullish | 2026-03 |
| Social Grants and Consumer Spending | 107 | 3.5 | 46 | ▲▲ 13.1x | Bearish | 2026-03 |
| Wall Street Bets Community | 2,067 | 14.5 | 176 | ▲▲ 12.1x | Neutral | 2026-03 |
| Financial News Interviews | 142 | 1.9 | 20 | ▲▲ 10.5x | Neutral | 2026-03 |
| Reddit Trading Community | 2,889 | 16.3 | 31 | ▲ 1.9x | Neutral | 2026-03 |
| Trading Challenge | 9 | 1.8 | 0 | ▼▼ 0.0x | Bearish | 2012-06 |
| ASIC Miner Market | 1 | 1.0 | 0 | ▼▼ 0.0x | Neutral | 2026-02 |
Activity = last 30 days ÷ monthly avg (e.g. 2.5x = 2.5× more mentions than usual). ▲▲ ≥2x | ▲ ≥1.3x | ─ near avg | ▼ below | ▼▼ <0.3x
This report is for informational purposes only and does not constitute financial advice. Always do your own research before making investment decisions.