Market Overview
SPY fell 0.57% while QQQ dropped 0.59%, with XLE, XLF in the green and XLV, XLK finishing lower. On the watchlist, CRMT was the biggest mover at -11.22%. The market data suggests a mixed bag of performances across various stocks and sectors. The top movers include CRMT, which fell by 11.22%, and META, which dropped by 3.83%. The news-driven move explanations reveal that CRMT's decline was attributed to America's Car-Mart focusing on securing its warehouse facility due to constrained inventory and sales volumes. META's decline was driven by several factors, including the stalling of its Persian Gulf cable project due to the ongoing war in Iran and the potential impact on the project's timeline and costs.
The narrative themes highlight the dominance of earnings season and corporate results, with 140 mentions in the last 24 hours. This is a significant increase from the long-term average, indicating a high level of interest and activity in this area. The top tickers in this theme include NVDA, ADBE, and PD, suggesting that technology and semiconductor companies are driving the conversation. The long-term sentiment for this theme is bullish, with a +0.17 average sentiment score.
The sectoral performance is also noteworthy, with XLE and XLF showing positive gains, while XLV and XLK experiencing declines. The watchlist tickers also reveal a mixed bag of performances, with CRMT and META being the biggest losers, while VRA and GIII showing gains. The overall market sentiment appears to be neutral, with a +0.09 average sentiment score across all themes. However, the high level of activity in earnings season and corporate results suggests that investors are closely watching the performance of technology and semiconductor companies.

Broad Market & Sector ETFs
| Ticker | Close | Change | Change% | Volume |
|---|---|---|---|---|
| QQQ | $593.72 | +$3.54 | -0.59% | 62,259,655 |
| SPY | $662.29 | +$3.77 | -0.57% | 83,073,510 |
| XLE | $57.70 | +$0.19 | +0.33% | 42,603,300 |
| XLF | $48.89 | +$0.06 | +0.12% | 46,955,367 |
| XLK | $136.80 | +$1.04 | -0.75% | 15,352,621 |
| XLV | $149.79 | +$0.37 | -0.25% | 15,053,753 |

Watchlist Performance
| Ticker | Close | Change | Change% | Volume |
|---|---|---|---|---|
| CRMT | $13.53 | +$1.71 | -11.22% | 490,741 |
| META | $613.71 | +$24.47 | -3.83% | 18,758,294 |
| DG | $131.84 | +$4.11 | -3.02% | 3,754,201 |
| VRA | $3.48 | +$0.10 | +2.96% | 950,858 |
| AAPL | $250.12 | +$5.64 | -2.21% | 34,193,754 |
| NVDA | $180.25 | +$2.89 | -1.58% | 156,420,571 |
| MSFT | $395.55 | +$6.31 | -1.57% | 26,350,249 |
| BMBL | $3.77 | +$0.04 | -1.05% | 9,869,977 |
| TSLA | $391.20 | +$3.81 | -0.96% | 57,370,326 |
| AMZN | $207.67 | +$1.86 | -0.89% | 34,201,623 |
| GIII | $26.38 | +$0.19 | +0.73% | 1,308,596 |
| GOOGL | $302.28 | +$1.27 | -0.42% | 23,511,708 |

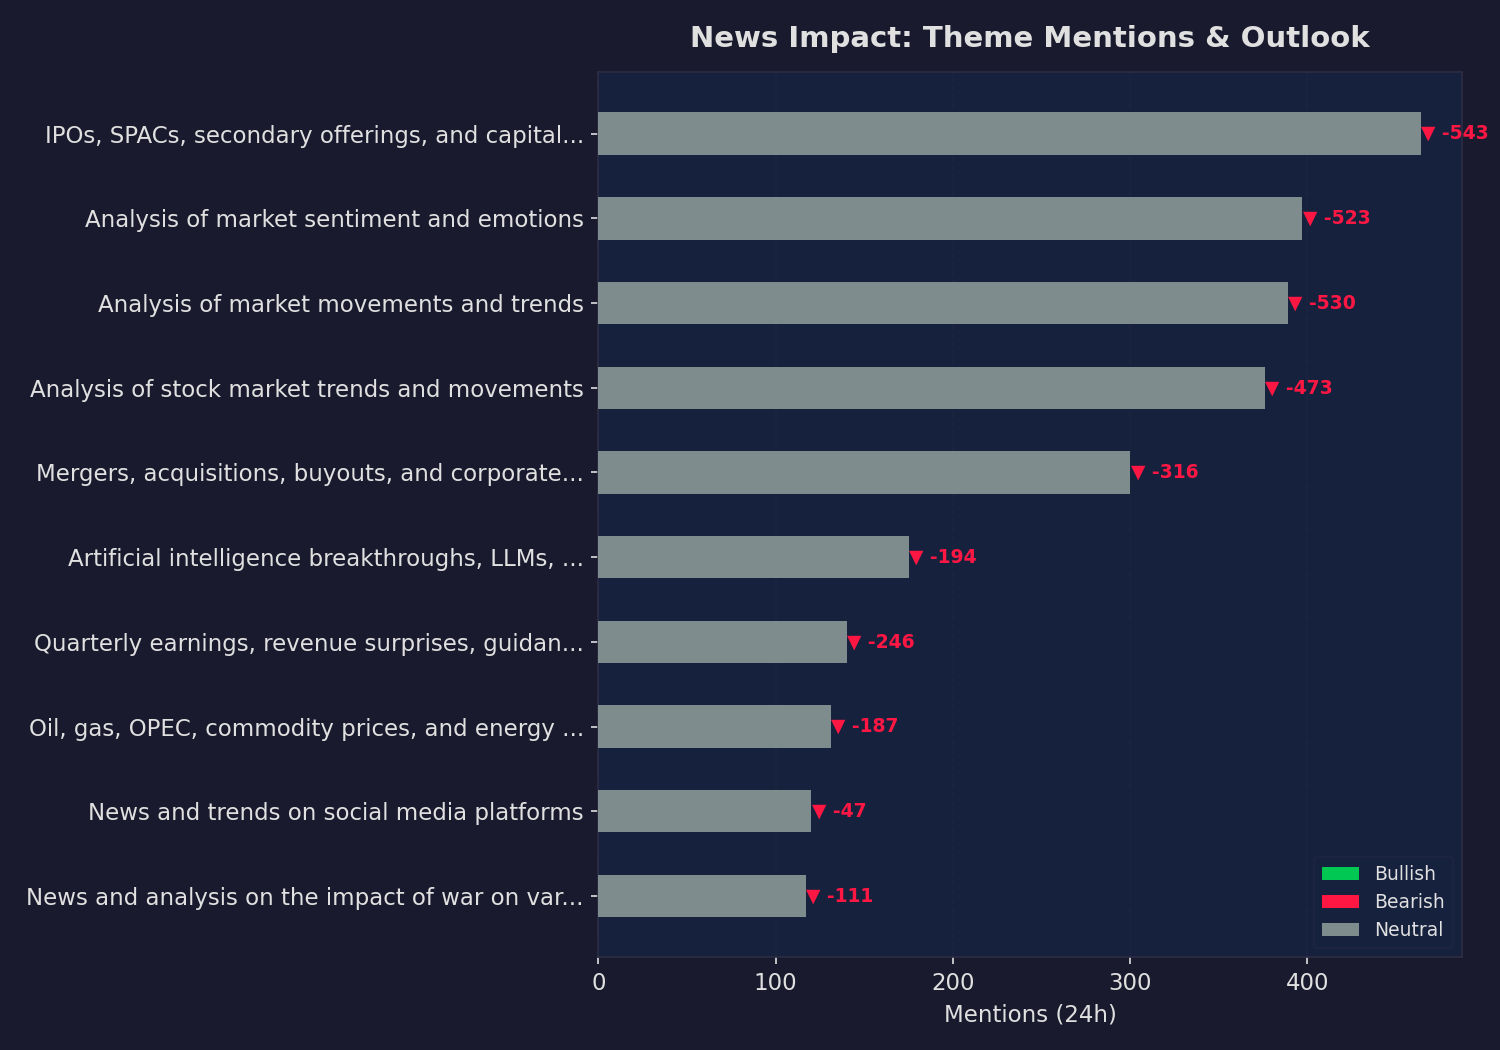
News Impact Classification
Today’s snapshot. Mentions = articles matched in the last 24 hours. Momentum = change vs. the previous 24-hour period.
Supporting Sources
- Netflix tops growth factor grades among S&P communication services holdings (Seeking Alpha Market News)
- Cathie Wood’s once upon a time $1,500 Zoom call by 2026 meets reality as software struggles (Seeking Alpha Market News)
- Wells Fargo shares slip for seven consecutive sessions (Seeking Alpha Market News)
- 20 software stocks under pressure as Adobe's decline weighs on sector (Seeking Alpha Market News)
- Micron’s stock is rising. Here’s the big question heading into earnings. (MarketWatch Top Stories)
- Himax pops on report linking to Nvida AI optics, Apple smart-glasses (Yahoo Finance)
- Option traders moderately bearish in Microsoft with shareslittle changed (Yahoo Finance)
- Netflix tops growth factor grades among S&P communication services holdings (Seeking Alpha Market News)
- Cathie Wood’s once upon a time $1,500 Zoom call by 2026 meets reality as software struggles (Seeking Alpha Market News)
- Warning: SDHC is at high risk of performing badly (Seeking Alpha Market News)
- Phillips 66 tops growth factor grades among S&P energy holdings (Seeking Alpha Market News)
- Micron’s stock is rising. Here’s the big question heading into earnings. (MarketWatch Top Stories)
- Option traders moderately bearish in Microsoft with shareslittle changed (Yahoo Finance)
- Wheaton Precious Metals CEO remains bullish on gold long-term (Seeking Alpha Market News)
- Netflix tops growth factor grades among S&P communication services holdings (Seeking Alpha Market News)
- Warning: SDHC is at high risk of performing badly (Seeking Alpha Market News)
- Wells Fargo shares slip for seven consecutive sessions (Seeking Alpha Market News)
- Phillips 66 tops growth factor grades among S&P energy holdings (Seeking Alpha Market News)
- 20 software stocks under pressure as Adobe's decline weighs on sector (Seeking Alpha Market News)
- Micron’s stock is rising. Here’s the big question heading into earnings. (MarketWatch Top Stories)
- Option traders moderately bearish in Microsoft with shareslittle changed (Yahoo Finance)
- Netflix tops growth factor grades among S&P communication services holdings (Seeking Alpha Market News)
- Cathie Wood’s once upon a time $1,500 Zoom call by 2026 meets reality as software struggles (Seeking Alpha Market News)
- Warning: SDHC is at high risk of performing badly (Seeking Alpha Market News)
- Phillips 66 tops growth factor grades among S&P energy holdings (Seeking Alpha Market News)
- 20 software stocks under pressure as Adobe's decline weighs on sector (Seeking Alpha Market News)
- Micron’s stock is rising. Here’s the big question heading into earnings. (MarketWatch Top Stories)
- Himax pops on report linking to Nvida AI optics, Apple smart-glasses (Yahoo Finance)
- Cathie Wood’s once upon a time $1,500 Zoom call by 2026 meets reality as software struggles (Seeking Alpha Market News)
- Micron’s stock is rising. Here’s the big question heading into earnings. (MarketWatch Top Stories)
- Option traders moderately bearish in Microsoft with shareslittle changed (Yahoo Finance)
- Wheaton Precious Metals CEO remains bullish on gold long-term (Seeking Alpha Market News)
- Boeing tops growth factor grades among S&P industrials holdings (Seeking Alpha Market News)
- Crypto Fear & Greed Index Has Been in Extreme Fear for 34 Days: XRP Rallied 1,000% Twice In Similar… (Yahoo Finance)
- Option traders moderately bearish in Coinbase with shares down 1.65% (Yahoo Finance)
- Cathie Wood’s once upon a time $1,500 Zoom call by 2026 meets reality as software struggles (Seeking Alpha Market News)
- Micron’s stock is rising. Here’s the big question heading into earnings. (MarketWatch Top Stories)
- Himax pops on report linking to Nvida AI optics, Apple smart-glasses (Yahoo Finance)
- CF Industries Is Up 76% and Fertilizer Supply Is Why (Yahoo Finance)
- Wheaton Precious Metals CEO remains bullish on gold long-term (Seeking Alpha Market News)
- Crypto Fear & Greed Index Has Been in Extreme Fear for 34 Days: XRP Rallied 1,000% Twice In Similar… (Yahoo Finance)
- Nio Price Prediction: 2026 Volume Growth Pushes NIO to $6.80 (Yahoo Finance)
- Micron’s stock is rising. Here’s the big question heading into earnings. (MarketWatch Top Stories)
- Himax pops on report linking to Nvida AI optics, Apple smart-glasses (Yahoo Finance)
- Wheaton Precious Metals CEO remains bullish on gold long-term (Seeking Alpha Market News)
- Stock Market Falls In Volatile Week As Oil Prices Surge; Oracle, Nvidia Buoy AI Plays: Weekly Review (Yahoo Finance)
- Ulta Beauty Price Prediction: Post-Earnings Selloff Creates Entry Opportunity (Yahoo Finance)
- Can Adobe’s next CEO turn around its battered stock? (MarketWatch Top Stories)
- Netflix tops growth factor grades among S&P communication services holdings (Seeking Alpha Market News)
- Micron’s stock is rising. Here’s the big question heading into earnings. (MarketWatch Top Stories)
- Wheaton Precious Metals CEO remains bullish on gold long-term (Seeking Alpha Market News)
- Boeing tops growth factor grades among S&P industrials holdings (Seeking Alpha Market News)
- JPMorgan warns investors are quietly moving away from gold since war began (Yahoo Finance)
- MARA Holdings Up 8%: The Most Divisive Stock in Crypto Just Made a Big Move (Yahoo Finance)
- Option traders moderately bearish in Microsoft with shareslittle changed (Yahoo Finance)
- Option traders moderately bearish in Coinbase with shares down 1.65% (Yahoo Finance)
- Option traders moderately bearish in Nike with shares down 1.92% (Yahoo Finance)
- BuzzFeed withholds forecast as it explores options for assets; shares fall (Seeking Alpha Market News)
- Apple cuts App Store commission fees in China to 25% (Seeking Alpha Market News)
- Tesla's China sales climb in the first two months of 2026 while BYD numbers drop (CNBC Top News)
- Cathie Wood’s once upon a time $1,500 Zoom call by 2026 meets reality as software struggles (Seeking Alpha Market News)
- Warning: SDHC is at high risk of performing badly (Seeking Alpha Market News)
- 20 software stocks under pressure as Adobe's decline weighs on sector (Seeking Alpha Market News)
- Micron’s stock is rising. Here’s the big question heading into earnings. (MarketWatch Top Stories)
- JPMorgan warns investors are quietly moving away from gold since war began (Yahoo Finance)
- Apple cuts App Store commission fees in China to 25% (Seeking Alpha Market News)
- Tesla's China sales climb in the first two months of 2026 while BYD numbers drop (CNBC Top News)
Theme History
Long-term theme baselines. Activity shows how the last 30 days of mentions compare to the historical monthly average — e.g. 2.5x means 2.5 times more mentions than usual. Tracked since 2006-05-01 (178 months of data).
| Theme | Total | Avg/Mo | Last 30d | Activity | Sentiment | Peak |
|---|---|---|---|---|---|---|
| Energy & Commodities | 3,965 | 26.3 | 1485 | ▲▲ 56.5x | Bullish | 2026-03 |
| Presidential Financial News | 1,440 | 10.5 | 548 | ▲▲ 52.2x | Neutral | 2026-03 |
| War Impact on Industry | 4,775 | 27.9 | 1297 | ▲▲ 46.5x | Neutral | 2026-03 |
| Geopolitical & Trade Tensions | 3,864 | 23.6 | 945 | ▲▲ 40.0x | Bullish | 2026-03 |
| Family Financial Planning | 707 | 7.2 | 288 | ▲▲ 40.0x | Bullish | 2026-03 |
| Market Movement Analysis | 22,579 | 126.8 | 5034 | ▲▲ 39.7x | Neutral | 2026-03 |
| Stock Market Analysis | 25,902 | 145.5 | 5368 | ▲▲ 36.9x | Bullish | 2026-03 |
| Market Sentiment Analysis | 19,855 | 115.4 | 4192 | ▲▲ 36.3x | Bullish | 2026-03 |
| Earnings Season & Corporate Results | 7,433 | 44.8 | 1616 | ▲▲ 36.1x | Bullish | 2026-03 |
| Sector Rotation | 4,301 | 26.2 | 940 | ▲▲ 35.9x | Bullish | 2026-03 |
| Consumer Spending & Retail | 560 | 5.4 | 177 | ▲▲ 32.8x | Bullish | 2026-03 |
| Tax Refund Issues | 457 | 4.4 | 138 | ▲▲ 31.4x | Bullish | 2026-03 |
| IPO & Capital Markets | 28,772 | 163.5 | 5009 | ▲▲ 30.6x | Bullish | 2026-03 |
| Mergers & Acquisitions | 7,999 | 66.7 | 1999 | ▲▲ 30.0x | Bullish | 2026-03 |
| Social Media Buzz | 6,913 | 41.4 | 1129 | ▲▲ 27.3x | Bullish | 2025-12 |
| AI & Technology Innovation | 8,835 | 76.2 | 1651 | ▲▲ 21.7x | Bullish | 2025-12 |
| Crypto & Digital Assets | 835 | 12.5 | 254 | ▲▲ 20.3x | Neutral | 2026-03 |
| Social Media Rebranding | 1,355 | 14.7 | 286 | ▲▲ 19.5x | Neutral | 2026-03 |
| Regulatory & Antitrust | 7,304 | 44.3 | 778 | ▲▲ 17.6x | Neutral | 2025-12 |
| Short Selling Strategies | 777 | 8.2 | 128 | ▲▲ 15.6x | Bullish | 2026-03 |
| Geopolitical Risk Assessment | 439 | 6.1 | 86 | ▲▲ 14.1x | Neutral | 2026-03 |
| Wall Street Bets Community | 1,570 | 15.1 | 186 | ▲▲ 12.3x | Neutral | 2026-03 |
| Labor Market & Employment | 1,532 | 42.6 | 506 | ▲▲ 11.9x | Neutral | 2026-03 |
| Federal Reserve & Interest Rates | 4,741 | 30.0 | 348 | ▲▲ 11.6x | Bullish | 2026-01 |
| Regulatory Risk Management | 635 | 19.8 | 186 | ▲▲ 9.4x | Bearish | 2026-03 |
| Apple Financial News | 4,616 | 28.1 | 219 | ▲▲ 7.8x | Bullish | 2026-01 |
| Reddit Trading Community | 2,432 | 26.7 | 189 | ▲▲ 7.1x | Neutral | 2026-03 |
| Tax Planning Strategy | 81 | 6.8 | 41 | ▲▲ 6.0x | Neutral | 2026-03 |
| Social Grants and Consumer Spending | 20 | 2.2 | 10 | ▲▲ 4.5x | Bearish | 2026-03 |
| Financial News Interviews | 34 | 1.9 | 8 | ▲▲ 4.2x | Bullish | 2026-03 |
| ASIC Miner Market | 1 | 1.0 | 1 | ─ 1.0x | Neutral | 2026-02 |
| Trading Challenge | 8 | 2.0 | 0 | ▼▼ 0.0x | Bearish | 2012-06 |
Activity = last 30 days ÷ monthly avg (e.g. 2.5x = 2.5× more mentions than usual). ▲▲ ≥2x | ▲ ≥1.3x | ─ near avg | ▼ below | ▼▼ <0.3x
This report is for informational purposes only and does not constitute financial advice. Always do your own research before making investment decisions.