Market Overview
SPY fell 1.52% while QQQ dropped 1.72%, with XLE in the green and XLF, XLV, XLK finishing lower. On the watchlist, TSLA was the biggest mover at -3.14%. Market Analysis
The stock market experienced a mixed day, with some sectors and stocks performing better than others. The Technology sector, represented by the XLK index, was one of the worst performers, down 1.84%. This is likely due to the decline of tech giants like Meta and Oracle, which were down 2.55% and 2.43%, respectively. On the other hand, the Energy sector, represented by the XLE index, was one of the best performers, up 0.93%. This is likely due to the increase in oil prices, which can have a positive impact on energy companies.
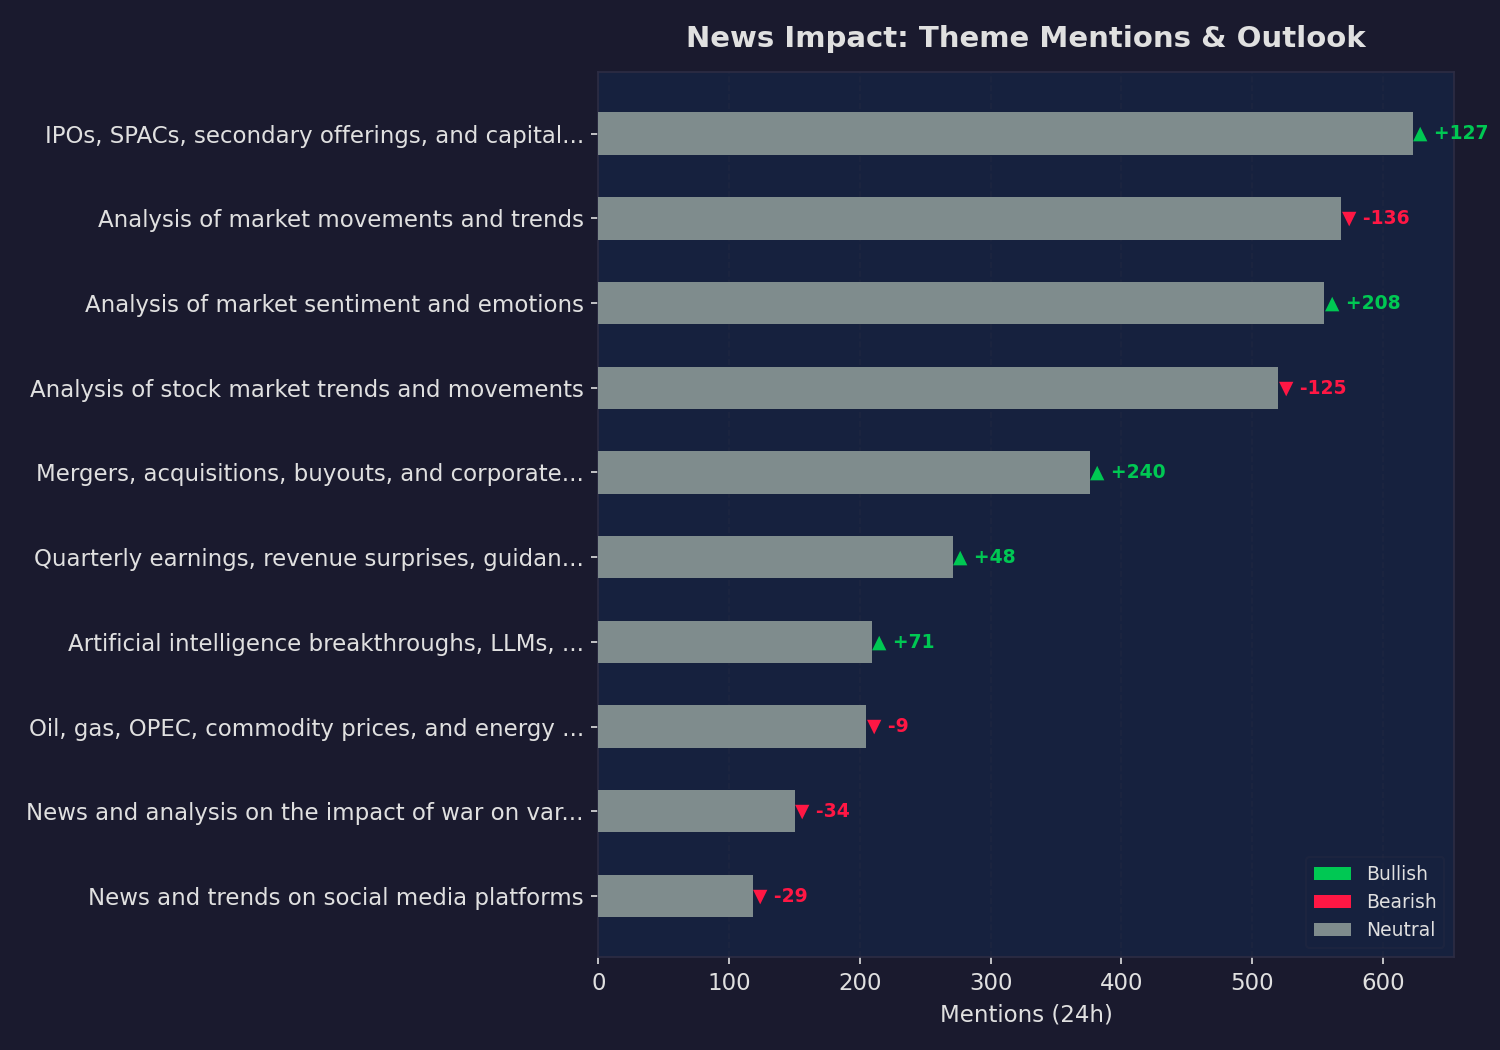
The news-driven move explanations provided insight into the reasons behind the price movements of specific stocks. For TSLA, the negative price movement can be attributed to a bear market prediction and the company's potential vulnerability to a significant price drop. On the other hand, Oracle's stock price rallied due to the company's strong earnings and guidance. The narrative themes also provided insight into the market's sentiment, with the "Mergers & Acquisitions" theme being the most prominent, with 376 mentions in the last 24 hours.
The long-term baselines provided by the theme history section offer a useful perspective on the market's trends. The "IPO & Capital Markets" theme has seen a significant increase in mentions over the last 30 days, with 4105 mentions, which is 37.0x the average. This suggests that the market is experiencing a surge in interest in initial public offerings and capital markets. The long-term sentiment of this theme is neutral, with a sentiment score of +0.08. Overall, the market analysis suggests that the stock market is experiencing a mixed day, with some sectors and stocks performing better than others, and a surge in interest in IPOs and capital markets.

Broad Market & Sector ETFs
| Ticker | Close | Change | Change% | Volume |
|---|---|---|---|---|
| QQQ | $597.26 | +$10.43 | -1.72% | 71,249,603 |
| SPY | $666.06 | +$10.27 | -1.52% | 107,906,562 |
| XLE | $57.51 | +$0.53 | +0.93% | 67,844,539 |
| XLF | $48.83 | +$0.81 | -1.63% | 67,523,306 |
| XLK | $137.84 | +$2.59 | -1.84% | 25,904,378 |
| XLV | $150.16 | +$2.69 | -1.76% | 14,956,163 |

Watchlist Performance
| Ticker | Close | Change | Change% | Volume |
|---|---|---|---|---|
| TSLA | $395.01 | +$12.81 | -3.14% | 59,382,702 |
| META | $638.18 | +$16.68 | -2.55% | 11,019,525 |
| ORCL | $159.16 | +$3.96 | -2.43% | 36,908,807 |
| AAPL | $255.76 | +$5.05 | -1.94% | 40,132,517 |
| GOOGL | $303.55 | +$5.15 | -1.67% | 24,717,197 |
| NVDA | $183.14 | +$2.89 | -1.55% | 153,887,196 |
| AMZN | $209.53 | +$3.12 | -1.47% | 44,067,157 |
| MSFT | $401.86 | +$3.02 | -0.75% | 26,767,393 |

News Impact Classification
Today’s snapshot. Mentions = articles matched in the last 24 hours. Momentum = change vs. the previous 24-hour period.
Supporting Sources
- HEICO Corporation (HEI) a Moderate Buy, Analysts See 23% Upside (Yahoo Finance)
- uniQure upgraded at Mizuho on improved outlook for Huntington's asset AMT-130 (Seeking Alpha Market News)
- CSCO – hold longer or sell? (r/stocks)
- Stocks making the biggest moves after hours: Adobe, Ulta Beauty, Lennar & more (CNBC Top News)
- Adobe slips despite record Q1 results; long-time CEO reveals plan to step down (Seeking Alpha Market News)
- Eli Lilly tops growth factor grades among S&P healthcare holdings (Seeking Alpha Market News)
- The S&P 500 just broke a major support. Another 10% decline is likely. (MarketWatch Top Stories)
- CSCO – hold longer or sell? (r/stocks)
- Stocks making the biggest moves after hours: Adobe, Ulta Beauty, Lennar & more (CNBC Top News)
- Adobe slips despite record Q1 results; long-time CEO reveals plan to step down (Seeking Alpha Market News)
- $750k on SM Energy (Undervalued US Oil Producer) (r/wallstreetbets)
- What Stocks are Terrible and Way Overpriced and Just Waiting for a High Inflation Bear Market?? (r/stocks)
- The S&P 500 just broke a major support. Another 10% decline is likely. (MarketWatch Top Stories)
- uniQure upgraded at Mizuho on improved outlook for Huntington's asset AMT-130 (Seeking Alpha Market News)
- CSCO – hold longer or sell? (r/stocks)
- Stocks making the biggest moves after hours: Adobe, Ulta Beauty, Lennar & more (CNBC Top News)
- Adobe slips despite record Q1 results; long-time CEO reveals plan to step down (Seeking Alpha Market News)
- Eli Lilly tops growth factor grades among S&P healthcare holdings (Seeking Alpha Market News)
- What Stocks are Terrible and Way Overpriced and Just Waiting for a High Inflation Bear Market?? (r/stocks)
- The S&P 500 just broke a major support. Another 10% decline is likely. (MarketWatch Top Stories)
- CSCO – hold longer or sell? (r/stocks)
- Stocks making the biggest moves after hours: Adobe, Ulta Beauty, Lennar & more (CNBC Top News)
- Adobe slips despite record Q1 results; long-time CEO reveals plan to step down (Seeking Alpha Market News)
- What Stocks are Terrible and Way Overpriced and Just Waiting for a High Inflation Bear Market?? (r/stocks)
- BWX Technologies started Buy at TD Cowen on 'unmatched nuclear heritage' (Seeking Alpha Market News)
- turned $8k into $18k betting on $MU earnings and now I'm YOLOing into April calls because… (r/wallstreetbets)
- uniQure upgraded at Mizuho on improved outlook for Huntington's asset AMT-130 (Seeking Alpha Market News)
- CSCO – hold longer or sell? (r/stocks)
- Senegal prime minister says contract for BP-operated gas project unfair (Seeking Alpha Market News)
- Stocks making the biggest moves after hours: Adobe, Ulta Beauty, Lennar & more (CNBC Top News)
- Adobe slips despite record Q1 results; long-time CEO reveals plan to step down (Seeking Alpha Market News)
- Eli Lilly tops growth factor grades among S&P healthcare holdings (Seeking Alpha Market News)
- $750k on SM Energy (Undervalued US Oil Producer) (r/wallstreetbets)
- uniQure upgraded at Mizuho on improved outlook for Huntington's asset AMT-130 (Seeking Alpha Market News)
- CSCO – hold longer or sell? (r/stocks)
- Adobe slips despite record Q1 results; long-time CEO reveals plan to step down (Seeking Alpha Market News)
- DICK'S projects $13.50–$14.50 EPS for 2026 as Foot Locker turnaround accelerates with 2–4% comp… (Seeking Alpha Market News)
- turned $8k into $18k betting on $MU earnings and now I'm YOLOing into April calls because… (r/wallstreetbets)
- Stifel Lifts VSE Corporation (VSEC)’s Price Target To $260, Keeps Buy Rating (Yahoo Finance)
- Dow, LyondellBasell upgraded at Citi as energy shock reshapes chemicals outlook (Seeking Alpha Market News)
- CSCO – hold longer or sell? (r/stocks)
- What Stocks are Terrible and Way Overpriced and Just Waiting for a High Inflation Bear Market?? (r/stocks)
- turned $8k into $18k betting on $MU earnings and now I'm YOLOing into April calls because… (r/wallstreetbets)
- Am I missing something on SM Energy ($SM)? The post-merger pessimism seems completely overblown if… (r/investing)
- Stifel Lifts VSE Corporation (VSEC)’s Price Target To $260, Keeps Buy Rating (Yahoo Finance)
- First Quantum Minerals upgraded ahead of anticipated restart of Cobre Panama mine (Yahoo Finance)
- Are oil/fuel/petrol/diesel companies a buy from Middle East conflict? (r/stocks)
- $750k on SM Energy (Undervalued US Oil Producer) (r/wallstreetbets)
- Murphy Oil raised to Buy at Piper Sandler, highlighting long-term Vietnam resource potential (Seeking Alpha Market News)
- Tether investment chief stepping down after reserve expansion (Seeking Alpha Market News)
- Am I missing something on SM Energy ($SM)? The post-merger pessimism seems completely overblown if… (r/investing)
- Income-Oriented ETFs: VYM Offers Greater Diversification, While HDV Boasts a Higher Yield (Yahoo Finance)
- Are oil/fuel/petrol/diesel companies a buy from Middle East conflict? (r/stocks)
- China widens BHP iron ore ban amid contract talks – Reuters (Seeking Alpha Market News)
- Senegal prime minister says contract for BP-operated gas project unfair (Seeking Alpha Market News)
- turned $8k into $18k betting on $MU earnings and now I'm YOLOing into April calls because… (r/wallstreetbets)
- The biggest shareholder of Wynn Resorts wants to take over Caesars Entertainment (Seeking Alpha Market News)
- Warren Buffett: Cash is necessary 'like oxygen'—but it's 'not a good asset' (CNBC Top News)
- Should QQQ Investors Sell Before the SpaceX IPO? (Yahoo Finance)
- First Quantum Minerals upgraded ahead of anticipated restart of Cobre Panama mine (Yahoo Finance)
- China widens BHP iron ore ban amid contract talks – Reuters (Seeking Alpha Market News)
- DICK'S projects $13.50–$14.50 EPS for 2026 as Foot Locker turnaround accelerates with 2–4% comp… (Seeking Alpha Market News)
- turned $8k into $18k betting on $MU earnings and now I'm YOLOing into April calls because… (r/wallstreetbets)
- Iran Supreme Leader Mojtaba Khamenei has verified account on X, Elon Musk's platform (CNBC Top News)
- Check XOMO, MLPA, and KRP’s Dividend Safety As Oil Hits $100 A Barrel (Yahoo Finance)
- Musk expects Digital Optimus ready for use in six months (Seeking Alpha Market News)
- BYD stock surged 8.4% on a disruptive tech announcement the same day it reported a 41% sales… (r/investing)
- Broad market looks comfortable, but tech hedging Is increasing. (r/options)
Theme History
Long-term theme baselines. Activity shows how the last 30 days of mentions compare to the historical monthly average — e.g. 2.5x means 2.5 times more mentions than usual. Tracked since 2006-05-01 (178 months of data).
| Theme | Total | Avg/Mo | Last 30d | Activity | Sentiment | Peak |
|---|---|---|---|---|---|---|
| Energy & Commodities | 2,472 | 16.4 | 1207 | ▲▲ 73.6x | Neutral | 2026-03 |
| Presidential Financial News | 1,101 | 8.0 | 450 | ▲▲ 56.2x | Neutral | 2026-03 |
| War Impact on Industry | 3,303 | 19.3 | 1078 | ▲▲ 55.9x | Neutral | 2026-03 |
| Mergers & Acquisitions | 3,077 | 25.6 | 1411 | ▲▲ 55.1x | Neutral | 2026-02 |
| Earnings Season & Corporate Results | 4,392 | 26.5 | 1338 | ▲▲ 50.5x | Bullish | 2026-03 |
| Geopolitical & Trade Tensions | 2,562 | 15.6 | 782 | ▲▲ 50.1x | Neutral | 2026-03 |
| Market Sentiment Analysis | 12,157 | 70.7 | 3370 | ▲▲ 47.7x | Neutral | 2026-03 |
| Market Movement Analysis | 15,915 | 89.4 | 4233 | ▲▲ 47.4x | Neutral | 2026-03 |
| Stock Market Analysis | 17,451 | 98.0 | 4619 | ▲▲ 47.1x | Neutral | 2026-03 |
| Social Media Buzz | 3,455 | 20.7 | 964 | ▲▲ 46.6x | Neutral | 2026-03 |
| Sector Rotation | 2,789 | 17.0 | 776 | ▲▲ 45.6x | Bullish | 2026-03 |
| Family Financial Planning | 554 | 5.7 | 223 | ▲▲ 39.1x | Neutral | 2026-03 |
| AI & Technology Innovation | 3,948 | 34.0 | 1293 | ▲▲ 38.0x | Neutral | 2026-02 |
| IPO & Capital Markets | 19,537 | 111.0 | 4105 | ▲▲ 37.0x | Neutral | 2026-03 |
| Consumer Spending & Retail | 400 | 3.9 | 139 | ▲▲ 35.6x | Neutral | 2026-03 |
| Tax Refund Issues | 347 | 3.3 | 105 | ▲▲ 31.8x | Neutral | 2026-03 |
| Crypto & Digital Assets | 543 | 8.1 | 205 | ▲▲ 25.3x | Neutral | 2026-03 |
| Social Media Rebranding | 938 | 10.2 | 239 | ▲▲ 23.4x | Neutral | 2026-03 |
| Short Selling Strategies | 533 | 5.6 | 110 | ▲▲ 19.6x | Bullish | 2026-03 |
| Regulatory & Antitrust | 6,245 | 37.8 | 742 | ▲▲ 19.6x | Neutral | 2026-02 |
| Labor Market & Employment | 713 | 19.8 | 387 | ▲▲ 19.6x | Neutral | 2026-03 |
| Geopolitical Risk Assessment | 269 | 3.7 | 70 | ▲▲ 18.9x | Neutral | 2026-03 |
| Regulatory Risk Management | 297 | 9.3 | 129 | ▲▲ 13.9x | Bearish | 2026-03 |
| Wall Street Bets Community | 1,386 | 13.3 | 173 | ▲▲ 13.0x | Neutral | 2026-03 |
| Federal Reserve & Interest Rates | 4,561 | 28.9 | 321 | ▲▲ 11.1x | Bullish | 2025-09 |
| Apple Financial News | 4,460 | 27.2 | 209 | ▲▲ 7.7x | Bullish | 2025-09 |
| Reddit Trading Community | 2,415 | 26.5 | 186 | ▲▲ 7.0x | Neutral | 2026-03 |
| Tax Planning Strategy | 57 | 5.7 | 34 | ▲▲ 6.0x | Neutral | 2026-02 |
| Social Grants and Consumer Spending | 16 | 2.0 | 9 | ▲▲ 4.5x | Bearish | 2026-03 |
| Financial News Interviews | 25 | 1.5 | 6 | ▲▲ 4.0x | Bullish | 2026-02 |
| ASIC Miner Market | 1 | 1.0 | 1 | ─ 1.0x | Neutral | 2026-02 |
| Trading Challenge | 7 | 2.3 | 0 | ▼▼ 0.0x | Bearish | 2012-06 |
Activity = last 30 days ÷ monthly avg (e.g. 2.5x = 2.5× more mentions than usual). ▲▲ ≥2x | ▲ ≥1.3x | ─ near avg | ▼ below | ▼▼ <0.3x
This report is for informational purposes only and does not constitute financial advice. Always do your own research before making investment decisions.