Market Overview
The S&P 500 (SPY) closed up +0.79% at $699.94. while the Nasdaq 100 (QQQ) was up +1.40%. Among sector ETFs, XLK led (+1.57%) and XLV lagged (-0.71%). On the watchlist, TSLA was the biggest mover, gaining +7.62%. Today's news flow was dominated by earnings events (7 of 10 top stories) with an overall bullish tilt (avg sentiment +0.44). The highest-confidence event: Johnson & Johnson reported strong growth in its oncology segment, setting a positive tone for Q1 earnings. Today's dynamic watchlist added 1 trending ticker: WFC (auto-discovered from high news activity and price movement).
Oil & Middle East conflict dominated headlines with 14 articles: Nearly 60% of U.S. farmers report worsening finances due to rising fertilizer and fuel costs, which could reduce crop yields and supply (limited direct market impact). Inflation & interest rates dominated headlines with 4 articles: Mortgage and refinance interest rates have dropped to sub-6% levels, potentially boosting market activity (mildly bearish).
Analyst ratings were active with 11 calls (7 positive, 2 negative, 2 neutral); notably, JPMorgan warns of increased market volatility due to geopolitical conflicts, advising investors to avoid 'bearish views'. 23 earnings-related events were reported; the standout was JPM: JPMorgan Chase reported a quarterly profit of $16.5bn, up 13% from the previous year.
To put today's corporate activity in historical context, here is how watchlist stocks have reacted to similar events in the past. Based on 99 past analyst rating events, AAPL historically rose 0.53% on day 1 and was gaining 0.73% by day 5, with a 69% positive-outcome rate. Based on 99 past acquisition events, AMZN historically fell 0.28% on day 1 and was gaining 0.57% by day 5, with a 48% positive-outcome rate. Based on 99 past market movement events, GOOGL historically rose 0.11% on day 1 and was gaining 0.56% by day 5, with a 39% positive-outcome rate. Based on 65 past partnership events, META historically rose 0.29% on day 1 and was gaining 0.36% by day 5, with a 60% positive-outcome rate. Based on 99 past market movement events, MSFT historically rose 0.04% on day 1 and was gaining 0.01% by day 5, with a 42% positive-outcome rate. Based on 98 past other events, NVDA historically rose 1.03% on day 1 and was gaining 3.93% by day 5, with a 95% positive-outcome rate. Based on 100 past analyst rating events, TSLA historically fell 0.45% on day 1 and was losing 1.27% by day 5, with a 40% positive-outcome rate. Based on 7 past analyst rating events, WFC historically rose 0.44% on day 1 and was losing 1.50% by day 5, with a 57% positive-outcome rate.
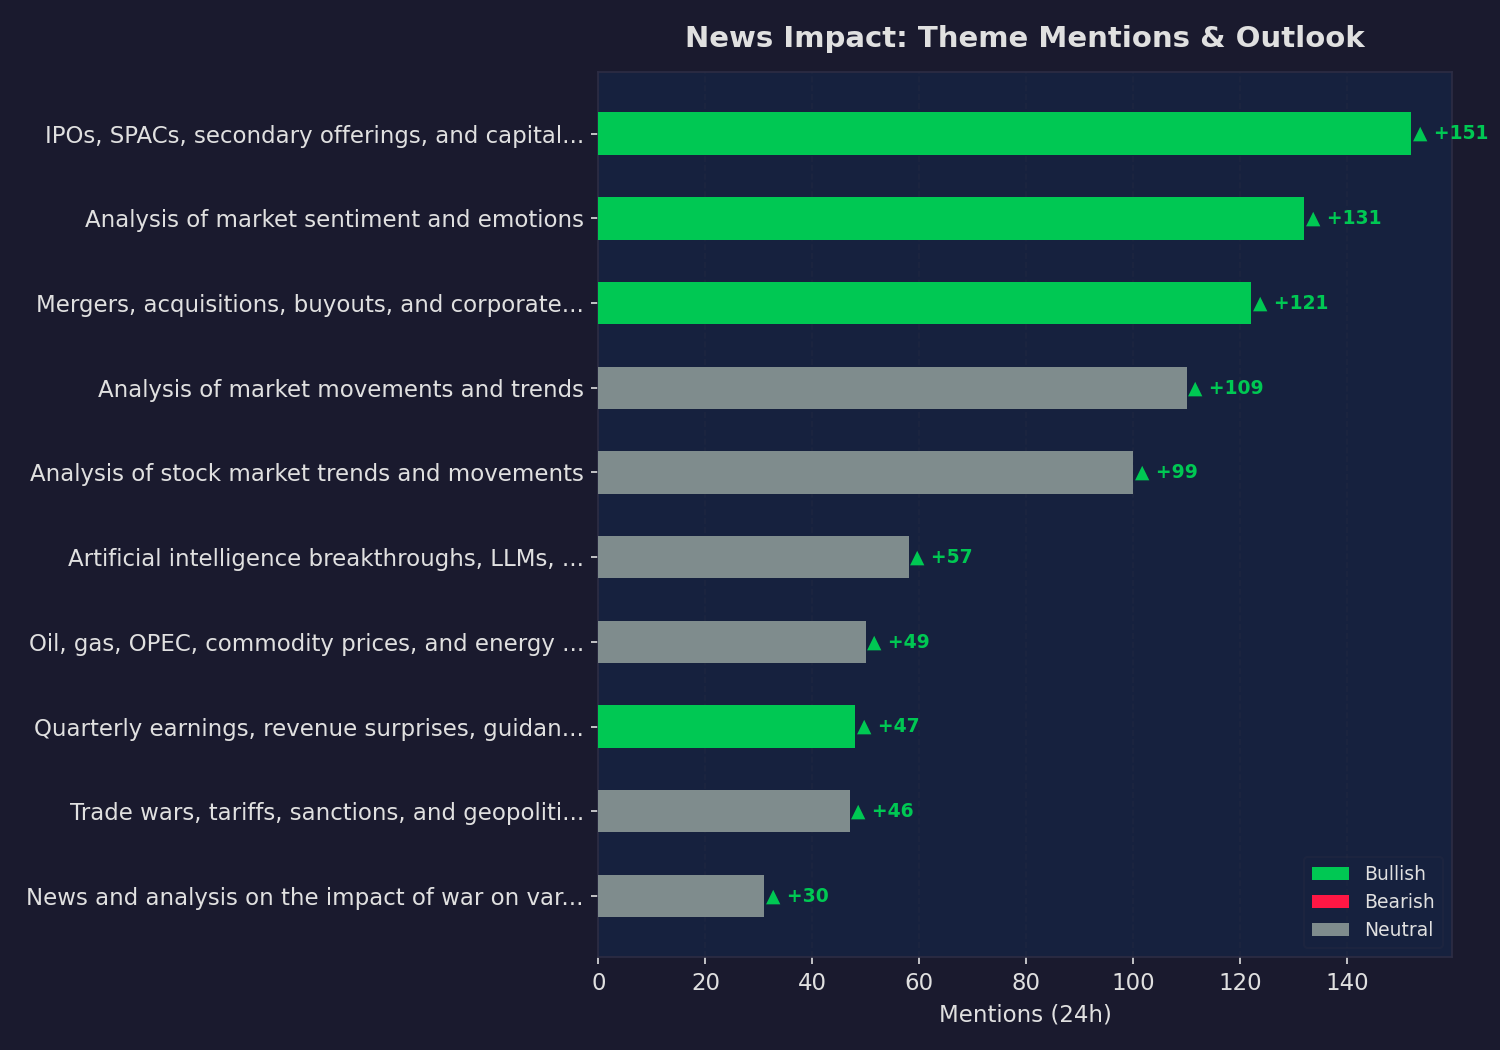
Stepping back to the broader market narrative, IPO & Capital Markets was the most active theme with 152 mentions in the last 24 hours (velocity +151.0, neutral sentiment at +0.18), linked to ASML, BAC, NVDA. Market Sentiment Analysis had 132 mentions and is accelerating (velocity +131.0, sentiment +0.18) (ASML, NVDA). Mergers & Acquisitions had 122 mentions and is accelerating (velocity +121.0, sentiment +0.18) (ASML, BAC). Market Movement Analysis had 110 mentions and is accelerating (velocity +109.0, sentiment +0.10) (NVDA, ASML).

Broad Market & Sector ETFs
| Ticker | Close | Change | Change% | Volume |
|---|---|---|---|---|
| QQQ | $637.40 | +$8.80 | +1.40% | 46,965,650 |
| SPY | $699.94 | +$5.48 | +0.79% | 50,747,981 |
| XLE | $55.76 | $0.19 | -0.34% | 37,542,916 |
| XLF | $52.16 | +$0.38 | +0.73% | 33,534,625 |
| XLK | $150.27 | +$2.33 | +1.57% | 10,172,993 |
| XLV | $147.77 | $1.06 | -0.71% | 6,048,802 |

Watchlist Performance
| Ticker | Close | Change | Change% | Volume |
|---|---|---|---|---|
| TSLA | $391.95 | +$27.75 | +7.62% | 111,620,638 |
| MSFT | $411.22 | +$18.11 | +4.61% | 43,012,959 |
| AAPL | $266.43 | +$7.60 | +2.94% | 45,208,096 |
| WFC | $80.29 | $1.41 | -1.73% | 30,965,492 |
| META | $671.58 | +$9.09 | +1.37% | 14,845,156 |
| GOOGL | $337.12 | +$4.21 | +1.26% | 24,221,028 |
| NVDA | $198.87 | +$2.36 | +1.20% | 177,529,760 |
| AMZN | $248.50 | $0.52 | -0.21% | 42,574,235 |

News Impact Classification
Today’s snapshot. Mentions = articles matched in the last 24 hours. Momentum = change vs. the previous 24-hour period.
Supporting Sources
- IBM unveils measures to help businesses tackle AI cyber threats (Seeking Alpha Market News)
- Taiwan Semiconductor likely to report 'strong' quarter, guidance, aided by AI: Wedbush (Seeking Alpha Market News)
- Earnings Snapshot: Morgan Stanley beats Q1 estimates; Institutional Securities hits $10.7B record… (Seeking Alpha Market News)
- Morgan Stanley Q1 earnings beat on back of trading surge, wealth management growth (Seeking Alpha Market News)
- Morgan Stanley in charts: Wealth Management, Institutional Securities revenue rise in double digits… (Seeking Alpha Market News)
- Apple may use OLED screens for iPad Air next year: report (Seeking Alpha Market News)
- Analyst Report: Lennar Corp (Yahoo Finance)
- IBM unveils measures to help businesses tackle AI cyber threats (Seeking Alpha Market News)
- Taiwan Semiconductor likely to report 'strong' quarter, guidance, aided by AI: Wedbush (Seeking Alpha Market News)
- Earnings Snapshot: Morgan Stanley beats Q1 estimates; Institutional Securities hits $10.7B record… (Seeking Alpha Market News)
- Viant Technology to acquire TVision Insight for $40M (Seeking Alpha Market News)
- Morgan Stanley Q1 earnings beat on back of trading surge, wealth management growth (Seeking Alpha Market News)
- Morgan Stanley in charts: Wealth Management, Institutional Securities revenue rise in double digits… (Seeking Alpha Market News)
- Apple may use OLED screens for iPad Air next year: report (Seeking Alpha Market News)
- Morgan Stanley Q1 earnings beat on back of trading surge, wealth management growth (Seeking Alpha Market News)
- Morgan Stanley in charts: Wealth Management, Institutional Securities revenue rise in double digits… (Seeking Alpha Market News)
- Scienture granted 180-day extension by Nasdaq to regain compliance (Seeking Alpha Market News)
- Analyst Report: Lennar Corp (Yahoo Finance)
- Analyst Report: Blackrock Inc (Yahoo Finance)
- Analyst Report: Wells Fargo & Co (Yahoo Finance)
- Starbucks launches beta app in ChatGPT to fuel new drink discovery (CNBC Top News)
- IBM unveils measures to help businesses tackle AI cyber threats (Seeking Alpha Market News)
- Taiwan Semiconductor likely to report 'strong' quarter, guidance, aided by AI: Wedbush (Seeking Alpha Market News)
- Viant Technology to acquire TVision Insight for $40M (Seeking Alpha Market News)
- Analyst Report: Lennar Corp (Yahoo Finance)
- Analyst Report: Blackrock Inc (Yahoo Finance)
- Analyst Report: Wells Fargo & Co (Yahoo Finance)
- Starbucks launches beta app in ChatGPT to fuel new drink discovery (CNBC Top News)
- Meta commits to one gigawatt of custom chips with Broadcom as Hock Tan agrees to leave board (CNBC Top News)
- SoftBank lenders ask more banks to join $40B OpenAI loan: report (Seeking Alpha Market News)
- Aurora Cannabis acquires Safari Flower Company for C$26.5M (Seeking Alpha Market News)
- TomaGold announces private placement of up to $1.5M (Seeking Alpha Market News)
- Graham announces $50M investment from accounts advised by T. Rowe Price (Seeking Alpha Market News)
- CarMax cut its prices to bring back buyers. It resulted in a $121 million loss (Yahoo Finance)
- Stock Market Today: Dow Wavers After Trump's Latest Iran Comments; ASML Falls On Earnings (Live… (Yahoo Finance)
- Taiwan Semiconductor likely to report 'strong' quarter, guidance, aided by AI: Wedbush (Seeking Alpha Market News)
- Earnings Snapshot: Morgan Stanley beats Q1 estimates; Institutional Securities hits $10.7B record… (Seeking Alpha Market News)
- Morgan Stanley Q1 earnings beat on back of trading surge, wealth management growth (Seeking Alpha Market News)
- Morgan Stanley in charts: Wealth Management, Institutional Securities revenue rise in double digits… (Seeking Alpha Market News)
- Scienture granted 180-day extension by Nasdaq to regain compliance (Seeking Alpha Market News)
- Analyst Report: Lennar Corp (Yahoo Finance)
- Analyst Report: Blackrock Inc (Yahoo Finance)
- Taiwan Semiconductor likely to report 'strong' quarter, guidance, aided by AI: Wedbush (Seeking Alpha Market News)
- Analyst Report: SoFi Technologies Inc (Yahoo Finance)
- Bank of America joins big bank peers in reporting rising profits, calls US economy 'resilient' (Yahoo Finance)
- Tariffs weigh on The Children’s Place Q4 profits (Yahoo Finance)
- Meta commits to one gigawatt of custom chips with Broadcom as Hock Tan agrees to leave board (CNBC Top News)
- SoftBank lenders ask more banks to join $40B OpenAI loan: report (Seeking Alpha Market News)
- BRP suspends FY27 guidance; new U.S. tariffs signal $500M+ profit headwind (Seeking Alpha Market News)
- Taiwan Semiconductor likely to report 'strong' quarter, guidance, aided by AI: Wedbush (Seeking Alpha Market News)
- Tariffs weigh on The Children’s Place Q4 profits (Yahoo Finance)
- Meta commits to one gigawatt of custom chips with Broadcom as Hock Tan agrees to leave board (CNBC Top News)
- Constellation Software’s Vela to acquire majority interest in Derbysoft Holdings (Seeking Alpha Market News)
- Nvidia’s latest AI models ignite surge in quantum computing stocks (Seeking Alpha Market News)
- Parsons JV lands $25M contract for Coast Guard modernization plan (Seeking Alpha Market News)
- JPMorgan warns of volatility as conflict grows and to avoid 'bearish views.’ How to invest without… (Yahoo Finance)
Theme History
Long-term theme baselines. Activity shows how the last 30 days of mentions compare to the historical monthly average — e.g. 2.5x means 2.5 times more mentions than usual. Tracked since 2006-03-20 (241 months of data).
| Theme | Total | Avg/Mo | Last 30d | Activity | Sentiment | Peak |
|---|---|---|---|---|---|---|
| Family Financial Planning | 4,152 | 24.4 | 2605 | ▲▲ 106.8x | Neutral | 2026-03 |
| Energy & Commodities | 15,656 | 82.0 | 7610 | ▲▲ 92.8x | Bullish | 2026-03 |
| Mergers & Acquisitions | 40,267 | 167.8 | 14809 | ▲▲ 88.2x | Bullish | 2026-03 |
| Geopolitical Risk Assessment | 2,858 | 23.0 | 1948 | ▲▲ 84.7x | Neutral | 2026-03 |
| Presidential Financial News | 4,809 | 27.8 | 2116 | ▲▲ 76.1x | Neutral | 2026-03 |
| Consumer Spending & Retail | 2,497 | 15.0 | 1096 | ▲▲ 73.1x | Neutral | 2026-03 |
| Geopolitical & Trade Tensions | 12,768 | 62.9 | 4565 | ▲▲ 72.6x | Bullish | 2026-03 |
| Regulatory Risk Management | 3,104 | 18.9 | 1371 | ▲▲ 72.5x | Bearish | 2026-03 |
| Market Sentiment Analysis | 66,440 | 275.7 | 19056 | ▲▲ 69.1x | Bullish | 2026-03 |
| Crypto & Digital Assets | 3,663 | 26.5 | 1776 | ▲▲ 67.0x | Neutral | 2026-03 |
| War Impact on Industry | 14,867 | 67.6 | 4469 | ▲▲ 66.1x | Neutral | 2026-03 |
| Market Movement Analysis | 61,773 | 258.5 | 16905 | ▲▲ 65.4x | Neutral | 2026-03 |
| IPO & Capital Markets | 82,983 | 344.3 | 22110 | ▲▲ 64.2x | Bullish | 2026-03 |
| Tax Refund Issues | 1,731 | 11.1 | 711 | ▲▲ 64.0x | Neutral | 2026-03 |
| AI & Technology Innovation | 28,444 | 137.4 | 8331 | ▲▲ 60.6x | Bullish | 2026-03 |
| Earnings Season & Corporate Results | 24,021 | 116.6 | 6766 | ▲▲ 58.0x | Bullish | 2026-03 |
| Stock Market Analysis | 67,390 | 283.2 | 15987 | ▲▲ 56.5x | Bullish | 2026-03 |
| Sector Rotation | 13,061 | 62.2 | 3462 | ▲▲ 55.7x | Bullish | 2026-03 |
| Social Media Rebranding | 5,708 | 28.3 | 1394 | ▲▲ 49.3x | Neutral | 2026-03 |
| Labor Market & Employment | 6,255 | 49.6 | 2382 | ▲▲ 48.0x | Neutral | 2026-03 |
| Social Media Buzz | 20,520 | 89.2 | 3724 | ▲▲ 41.8x | Bullish | 2026-03 |
| Short Selling Strategies | 2,004 | 16.2 | 647 | ▲▲ 39.9x | Bullish | 2026-03 |
| Regulatory & Antitrust | 11,335 | 60.3 | 2326 | ▲▲ 38.6x | Neutral | 2026-03 |
| Tax Planning Strategy | 466 | 9.1 | 278 | ▲▲ 30.6x | Neutral | 2026-03 |
| Federal Reserve & Interest Rates | 6,991 | 38.4 | 1146 | ▲▲ 29.8x | Neutral | 2026-03 |
| Apple Financial News | 6,380 | 33.8 | 617 | ▲▲ 18.2x | Bullish | 2026-03 |
| Wall Street Bets Community | 2,052 | 14.3 | 238 | ▲▲ 16.6x | Neutral | 2026-03 |
| Social Grants and Consumer Spending | 106 | 3.4 | 55 | ▲▲ 16.2x | Bearish | 2026-03 |
| Financial News Interviews | 142 | 1.9 | 30 | ▲▲ 15.8x | Neutral | 2026-03 |
| Reddit Trading Community | 2,886 | 16.3 | 43 | ▲▲ 2.6x | Neutral | 2026-03 |
| Trading Challenge | 9 | 1.8 | 0 | ▼▼ 0.0x | Bearish | 2012-06 |
| ASIC Miner Market | 1 | 1.0 | 0 | ▼▼ 0.0x | Neutral | 2026-02 |
Activity = last 30 days ÷ monthly avg (e.g. 2.5x = 2.5× more mentions than usual). ▲▲ ≥2x | ▲ ≥1.3x | ─ near avg | ▼ below | ▼▼ <0.3x
This report is for informational purposes only and does not constitute financial advice. Always do your own research before making investment decisions.