Market Overview
SPY fell 1.79% while QQQ dropped 2.39%, with XLE in the green and XLV, XLF, XLK finishing lower. On the watchlist, FNMA was the biggest mover at -8.55%. Based on the news impact classification, today's market was significantly influenced by news articles, with a total of 13,253 mentions in the last 24 hours, a 36.2x increase from the average monthly volume. The active themes driving this news volume include "Consumer Spending & Retail" with 61 mentions, "Sector Rotation" with 63 mentions, and "Family Financial Planning" with 102 mentions. Notably, the "IPO & Capital Markets" theme has seen a substantial increase in the last 30 days, with 14,835 mentions, which is 51.0x the average monthly volume, indicating a high level of activity and interest in this area.
Looking at the market performance, the energy sector (XLE) led the gains with a 1.58% increase, while the technology sector (XLK) was the laggard, declining by 3.11%. Among the watchlist stocks, FNMA (Fannie Mae) was the biggest loser, dropping by 8.55%, followed by META (Meta Platforms Inc.) with a 7.96% decrease. On the other hand, AAPL (Apple Inc.) was the only gainer, with a 0.11% increase. The overall market sentiment, as reflected by the long-term themes, remains bullish, with the "IPO & Capital Markets" theme showing a long-term sentiment score of +0.12.

Broad Market & Sector ETFs
| Ticker | Close | Change | Change% | Volume |
|---|---|---|---|---|
| QQQ | $573.79 | $14.03 | -2.39% | 76,076,123 |
| SPY | $645.09 | $11.73 | -1.79% | 92,903,674 |
| XLE | $61.52 | +$0.95 | +1.57% | 54,741,364 |
| XLF | $49.05 | $0.29 | -0.59% | 43,174,534 |
| XLK | $132.50 | $4.26 | -3.11% | 15,278,488 |
| XLV | $145.74 | $0.50 | -0.34% | 13,263,320 |

Watchlist Performance
| Ticker | Close | Change | Change% | Volume |
|---|---|---|---|---|
| FNMA | $4.92 | $0.46 | -8.55% | 2,891,010 |
| META | $547.54 | $47.35 | -7.96% | 34,368,583 |
| MU | $355.46 | $26.63 | -6.97% | 53,711,519 |
| PLTR | $147.56 | $7.40 | -4.78% | 42,524,855 |
| NVDA | $171.24 | $7.44 | -4.16% | 182,162,282 |
| TSLA | $372.11 | $13.84 | -3.59% | 54,835,418 |
| GOOGL | $280.92 | $10.01 | -3.44% | 38,619,037 |
| AMZN | $207.54 | $4.17 | -1.97% | 45,915,765 |
| MSFT | $365.97 | $5.07 | -1.37% | 36,436,874 |
| AAPL | $252.89 | +$0.27 | +0.11% | 41,331,888 |

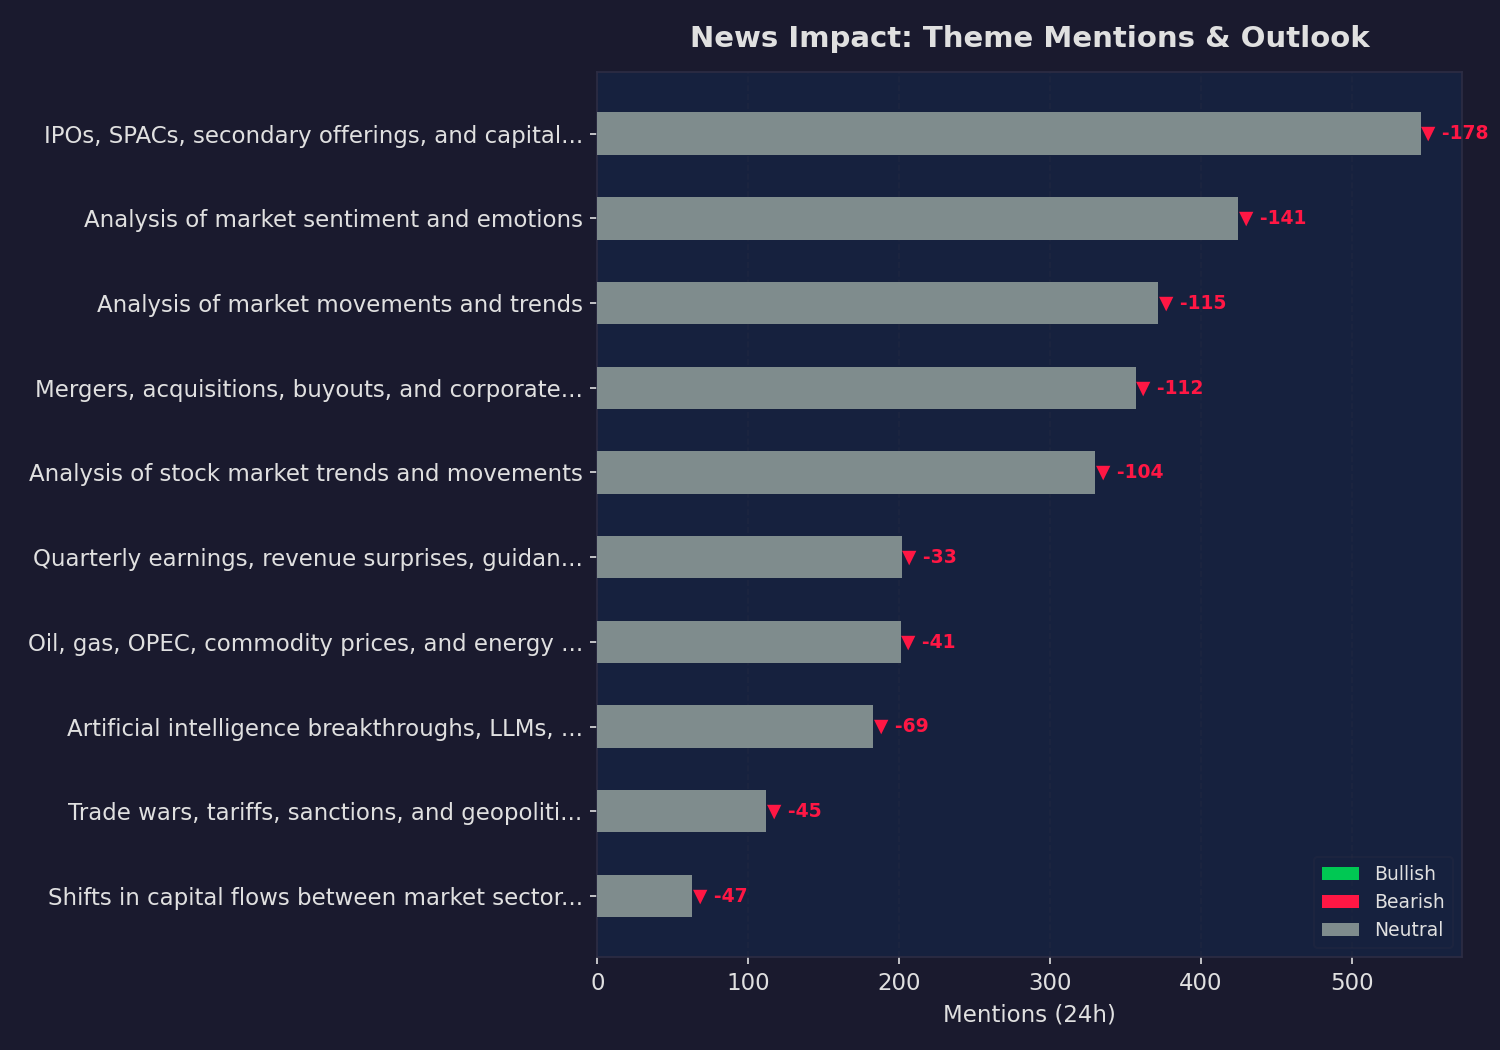
News Impact Classification
Today’s snapshot. Mentions = articles matched in the last 24 hours. Momentum = change vs. the previous 24-hour period.
Supporting Sources
- Middle East tensions push global oil prices up by 2% (Yahoo Finance)
- Worst performing Mortgage REITs in the past one month (Seeking Alpha Market News)
- Why memory chip stocks are getting hit hard for the second day in a row (CNBC Top News)
- 'Magnificent 7' stocks are seeing a shocking run: Chart (Yahoo Finance)
- Best Buy’s stock is rallying amid takeover speculation. But here’s the real story. (MarketWatch Top Stories)
- Will Rising Gas Prices Send Costco's Stock Higher? (Yahoo Finance)
- Cipher Mining Falls 9%, Bitmine Immersion Drops 6%: Is Bitcoin’s Price Move Punishing Crypto Mining… (Yahoo Finance)
- Middle East tensions push global oil prices up by 2% (Yahoo Finance)
- Worst performing Mortgage REITs in the past one month (Seeking Alpha Market News)
- Why memory chip stocks are getting hit hard for the second day in a row (CNBC Top News)
- Nasdaq slumps 2% as U.S.-Iran conflict continues to shake markets (Seeking Alpha Market News)
- Why WhiteFiber Stock Dropped Today (Yahoo Finance)
- 'Magnificent 7' stocks are seeing a shocking run: Chart (Yahoo Finance)
- Best Buy’s stock is rallying amid takeover speculation. But here’s the real story. (MarketWatch Top Stories)
- Middle East tensions push global oil prices up by 2% (Yahoo Finance)
- Worst performing Mortgage REITs in the past one month (Seeking Alpha Market News)
- Why memory chip stocks are getting hit hard for the second day in a row (CNBC Top News)
- Nasdaq slumps 2% as U.S.-Iran conflict continues to shake markets (Seeking Alpha Market News)
- Why WhiteFiber Stock Dropped Today (Yahoo Finance)
- Will Rising Gas Prices Send Costco's Stock Higher? (Yahoo Finance)
- Cipher Mining Falls 9%, Bitmine Immersion Drops 6%: Is Bitcoin’s Price Move Punishing Crypto Mining… (Yahoo Finance)
- Middle East tensions push global oil prices up by 2% (Yahoo Finance)
- Worst performing Mortgage REITs in the past one month (Seeking Alpha Market News)
- Why memory chip stocks are getting hit hard for the second day in a row (CNBC Top News)
- Best Buy’s stock is rallying amid takeover speculation. But here’s the real story. (MarketWatch Top Stories)
- Will Rising Gas Prices Send Costco's Stock Higher? (Yahoo Finance)
- Hertz and Avis rally as airport gridlock fuels demand for car rentals (Seeking Alpha Market News)
- Here’s How Much a $100 Investment in the 5 Best Performing Stocks in the Last 10 Years Would Be… (Yahoo Finance)
- Worst performing Mortgage REITs in the past one month (Seeking Alpha Market News)
- Why memory chip stocks are getting hit hard for the second day in a row (CNBC Top News)
- Nasdaq slumps 2% as U.S.-Iran conflict continues to shake markets (Seeking Alpha Market News)
- Why WhiteFiber Stock Dropped Today (Yahoo Finance)
- 'Magnificent 7' stocks are seeing a shocking run: Chart (Yahoo Finance)
- Best Buy’s stock is rallying amid takeover speculation. But here’s the real story. (MarketWatch Top Stories)
- Will Rising Gas Prices Send Costco's Stock Higher? (Yahoo Finance)
- Middle East tensions push global oil prices up by 2% (Yahoo Finance)
- Worst performing Mortgage REITs in the past one month (Seeking Alpha Market News)
- Why memory chip stocks are getting hit hard for the second day in a row (CNBC Top News)
- Nasdaq slumps 2% as U.S.-Iran conflict continues to shake markets (Seeking Alpha Market News)
- 'Magnificent 7' stocks are seeing a shocking run: Chart (Yahoo Finance)
- Will Rising Gas Prices Send Costco's Stock Higher? (Yahoo Finance)
- Cipher Mining Falls 9%, Bitmine Immersion Drops 6%: Is Bitcoin’s Price Move Punishing Crypto Mining… (Yahoo Finance)
- Middle East tensions push global oil prices up by 2% (Yahoo Finance)
- Worst performing Mortgage REITs in the past one month (Seeking Alpha Market News)
- Nasdaq slumps 2% as U.S.-Iran conflict continues to shake markets (Seeking Alpha Market News)
- Will Rising Gas Prices Send Costco's Stock Higher? (Yahoo Finance)
- Here’s How Much a $100 Investment in the 5 Best Performing Stocks in the Last 10 Years Would Be… (Yahoo Finance)
- Smithfield Near Breakout As Iran War Drives Food, Plastics Prices (Yahoo Finance)
- Cold storage trough in sight as vacancies hit 20-year high (Yahoo Finance)
- Worst performing Mortgage REITs in the past one month (Seeking Alpha Market News)
- Nasdaq slumps 2% as U.S.-Iran conflict continues to shake markets (Seeking Alpha Market News)
- Here’s How Much a $100 Investment in the 5 Best Performing Stocks in the Last 10 Years Would Be… (Yahoo Finance)
- Smithfield Near Breakout As Iran War Drives Food, Plastics Prices (Yahoo Finance)
- Warren Buffett Wins Again. Berkshire’s Newest Investment Is Up 35%. (Yahoo Finance)
- Stock Market Today: Dow Slides As Trump Warns Iran To 'Get Serious Soon'; Oil Prices Surge Higher… (Yahoo Finance)
- Dow Jones Futures Fall, Oil Prices Rise; Trump Warns Iran To 'Get Serious Before It Is Too Late' (Yahoo Finance)
- Cipher Mining Falls 9%, Bitmine Immersion Drops 6%: Is Bitcoin’s Price Move Punishing Crypto Mining… (Yahoo Finance)
- Smithfield Near Breakout As Iran War Drives Food, Plastics Prices (Yahoo Finance)
- Technical Assessment: Bullish in the Intermediate-Term (Yahoo Finance)
- AppLovin Plunges 8% as Short Sellers Circle: Is APP’s AI Growth Story Under Threat? (Yahoo Finance)
- H&M shares decline as clothing retailer warns of discounts (MarketWatch Top Stories)
- Chevron (CVX) Price Target Raised by Bernstein on Stronger Crude Backdrop (Yahoo Finance)
- Top Quant rated undervalued large-cap stocks with high-growth grades (Seeking Alpha Market News)
- 'Magnificent 7' stocks are seeing a shocking run: Chart (Yahoo Finance)
- Technical Assessment: Bullish in the Intermediate-Term (Yahoo Finance)
- AppLovin Plunges 8% as Short Sellers Circle: Is APP’s AI Growth Story Under Threat? (Yahoo Finance)
- MARA Holdings’ Stock Jumps On Plan To Reduce Debt (Yahoo Finance)
- Hedge Funds are Loading Up on Boeing. Here’s Why the Smart Money Isn’t Hesitating (Yahoo Finance)
- NVIDIA Owns the Spotlight, But the Smart Money is Moving Downstream (Yahoo Finance)
- Southland Holdings stock surges 50% after $118M project notice to proceed (Seeking Alpha Market News)
Theme History
Long-term theme baselines. Activity shows how the last 30 days of mentions compare to the historical monthly average — e.g. 2.5x means 2.5 times more mentions than usual. Tracked since 2006-03-20 (240 months of data).
| Theme | Total | Avg/Mo | Last 30d | Activity | Sentiment | Peak |
|---|---|---|---|---|---|---|
| Family Financial Planning | 2,511 | 14.9 | 1382 | ▲▲ 92.8x | Neutral | 2026-03 |
| Energy & Commodities | 11,214 | 59.0 | 4982 | ▲▲ 84.4x | Bullish | 2026-03 |
| Presidential Financial News | 3,595 | 20.9 | 1608 | ▲▲ 76.9x | Neutral | 2026-03 |
| Mergers & Acquisitions | 31,345 | 131.2 | 8492 | ▲▲ 64.7x | Bullish | 2026-03 |
| War Impact on Industry | 12,357 | 56.4 | 3568 | ▲▲ 63.3x | Neutral | 2026-03 |
| Regulatory Risk Management | 2,365 | 14.5 | 898 | ▲▲ 61.9x | Bearish | 2026-03 |
| Consumer Spending & Retail | 1,768 | 10.7 | 653 | ▲▲ 61.0x | Neutral | 2026-03 |
| Geopolitical & Trade Tensions | 10,106 | 50.0 | 3027 | ▲▲ 60.5x | Bullish | 2026-03 |
| Market Movement Analysis | 52,033 | 218.6 | 13034 | ▲▲ 59.6x | Neutral | 2026-03 |
| Crypto & Digital Assets | 2,655 | 19.4 | 1125 | ▲▲ 58.0x | Neutral | 2026-03 |
| Market Sentiment Analysis | 55,231 | 230.1 | 12963 | ▲▲ 56.3x | Bullish | 2026-03 |
| Tax Refund Issues | 1,296 | 8.4 | 456 | ▲▲ 54.3x | Neutral | 2026-03 |
| Stock Market Analysis | 58,093 | 245.1 | 12688 | ▲▲ 51.8x | Bullish | 2026-03 |
| IPO & Capital Markets | 69,850 | 291.0 | 14835 | ▲▲ 51.0x | Bullish | 2026-03 |
| Geopolitical Risk Assessment | 1,367 | 11.1 | 559 | ▲▲ 50.4x | Neutral | 2026-03 |
| Sector Rotation | 11,110 | 53.2 | 2659 | ▲▲ 50.0x | Bullish | 2026-03 |
| Earnings Season & Corporate Results | 20,048 | 97.8 | 4609 | ▲▲ 47.1x | Bullish | 2026-03 |
| AI & Technology Innovation | 23,485 | 114.0 | 5270 | ▲▲ 46.2x | Bullish | 2026-03 |
| Labor Market & Employment | 4,818 | 38.5 | 1607 | ▲▲ 41.7x | Neutral | 2026-03 |
| Social Media Rebranding | 4,871 | 24.2 | 930 | ▲▲ 38.4x | Neutral | 2026-03 |
| Social Media Buzz | 18,381 | 80.3 | 2758 | ▲▲ 34.4x | Bullish | 2026-03 |
| Regulatory & Antitrust | 9,936 | 53.1 | 1573 | ▲▲ 29.6x | Neutral | 2026-03 |
| Short Selling Strategies | 1,575 | 12.8 | 374 | ▲▲ 29.2x | Bullish | 2026-03 |
| Tax Planning Strategy | 272 | 5.4 | 132 | ▲▲ 24.4x | Neutral | 2026-03 |
| Federal Reserve & Interest Rates | 6,375 | 35.2 | 825 | ▲▲ 23.4x | Bullish | 2026-03 |
| Wall Street Bets Community | 1,914 | 13.5 | 296 | ▲▲ 21.9x | Neutral | 2026-03 |
| Financial News Interviews | 129 | 1.7 | 26 | ▲▲ 15.3x | Neutral | 2026-03 |
| Reddit Trading Community | 2,863 | 16.3 | 215 | ▲▲ 13.2x | Neutral | 2026-03 |
| Social Grants and Consumer Spending | 63 | 2.1 | 26 | ▲▲ 12.4x | Bearish | 2026-03 |
| Apple Financial News | 5,953 | 31.7 | 315 | ▲▲ 9.9x | Bullish | 2025-09 |
| ASIC Miner Market | 1 | 1.0 | 1 | ─ 1.0x | Neutral | 2026-02 |
| Trading Challenge | 9 | 1.8 | 0 | ▼▼ 0.0x | Bearish | 2012-06 |
Activity = last 30 days ÷ monthly avg (e.g. 2.5x = 2.5× more mentions than usual). ▲▲ ≥2x | ▲ ≥1.3x | ─ near avg | ▼ below | ▼▼ <0.3x
This report is for informational purposes only and does not constitute financial advice. Always do your own research before making investment decisions.