Market Overview
SPY fell 0.32% while QQQ dropped 0.68%, with XLE, XLF, XLV in the green and XLK finishing lower. On the watchlist, GOOGL was the biggest mover at -3.85%. Based on today's market performance, we can observe a mixed bag of movements among the tech giants and energy stocks. Alphabet Inc. (GOOGL) led the tech sector with a significant drop of 3.85%, possibly due to ongoing antitrust concerns and slowing growth in its core advertising business. Similarly, Meta Platforms Inc. (META) and Amazon.com Inc. (AMZN) also experienced declines of 1.84% and 1.38% respectively, suggesting broader sectoral weakness. However, it was not all doom and gloom for tech, as Tesla Inc. (TSLA) managed to eke out a gain of 0.57%, perhaps buoyed by its recent price cuts and increased demand for electric vehicles.
On the other hand, the energy sector, as represented by the XLE ETF, saw a robust gain of 2.03%. This can be attributed to the geopolitical tensions in the Middle East, which have led to supply disruptions and subsequent price increases for oil. Chevron Corporation (CVX), a major player in the sector, extended its winning streak to seven consecutive trading sessions, indicating positive market sentiment. Interestingly, despite the overall strength in energy, Micron Technology Inc. (MU), a semiconductor company with significant exposure to the sector, experienced a drop of 2.18%. This could be due to increased competition from rival SK Hynix, which is planning to invest heavily in the sector.

Broad Market & Sector ETFs
| Ticker | Close | Change | Change% | Volume |
|---|---|---|---|---|
| QQQ | $583.98 | $4.02 | -0.68% | 50,831,532 |
| SPY | $653.26 | $2.12 | -0.32% | 80,935,245 |
| XLE | $60.84 | +$1.21 | +2.03% | 48,879,244 |
| XLF | $49.28 | +$0.01 | +0.02% | 43,075,939 |
| XLK | $136.15 | $0.80 | -0.58% | 15,853,208 |
| XLV | $144.79 | +$0.02 | +0.01% | 24,100,128 |

Watchlist Performance
| Ticker | Close | Change | Change% | Volume |
|---|---|---|---|---|
| GOOGL | $290.44 | $11.62 | -3.85% | 36,042,261 |
| PLTR | $154.78 | $6.06 | -3.77% | 54,262,366 |
| MSFT | $372.74 | $10.26 | -2.68% | 40,186,581 |
| MU | $395.53 | $8.82 | -2.18% | 43,772,728 |
| META | $592.92 | $11.14 | -1.84% | 10,440,524 |
| AMZN | $207.24 | $2.90 | -1.38% | 34,266,291 |
| FNMA | $5.50 | $0.06 | -1.08% | 2,017,949 |
| TSLA | $383.03 | +$2.18 | +0.57% | 59,259,313 |
| NVDA | $175.20 | $0.44 | -0.25% | 142,336,713 |
| AAPL | $251.64 | +$0.15 | +0.06% | 27,882,961 |

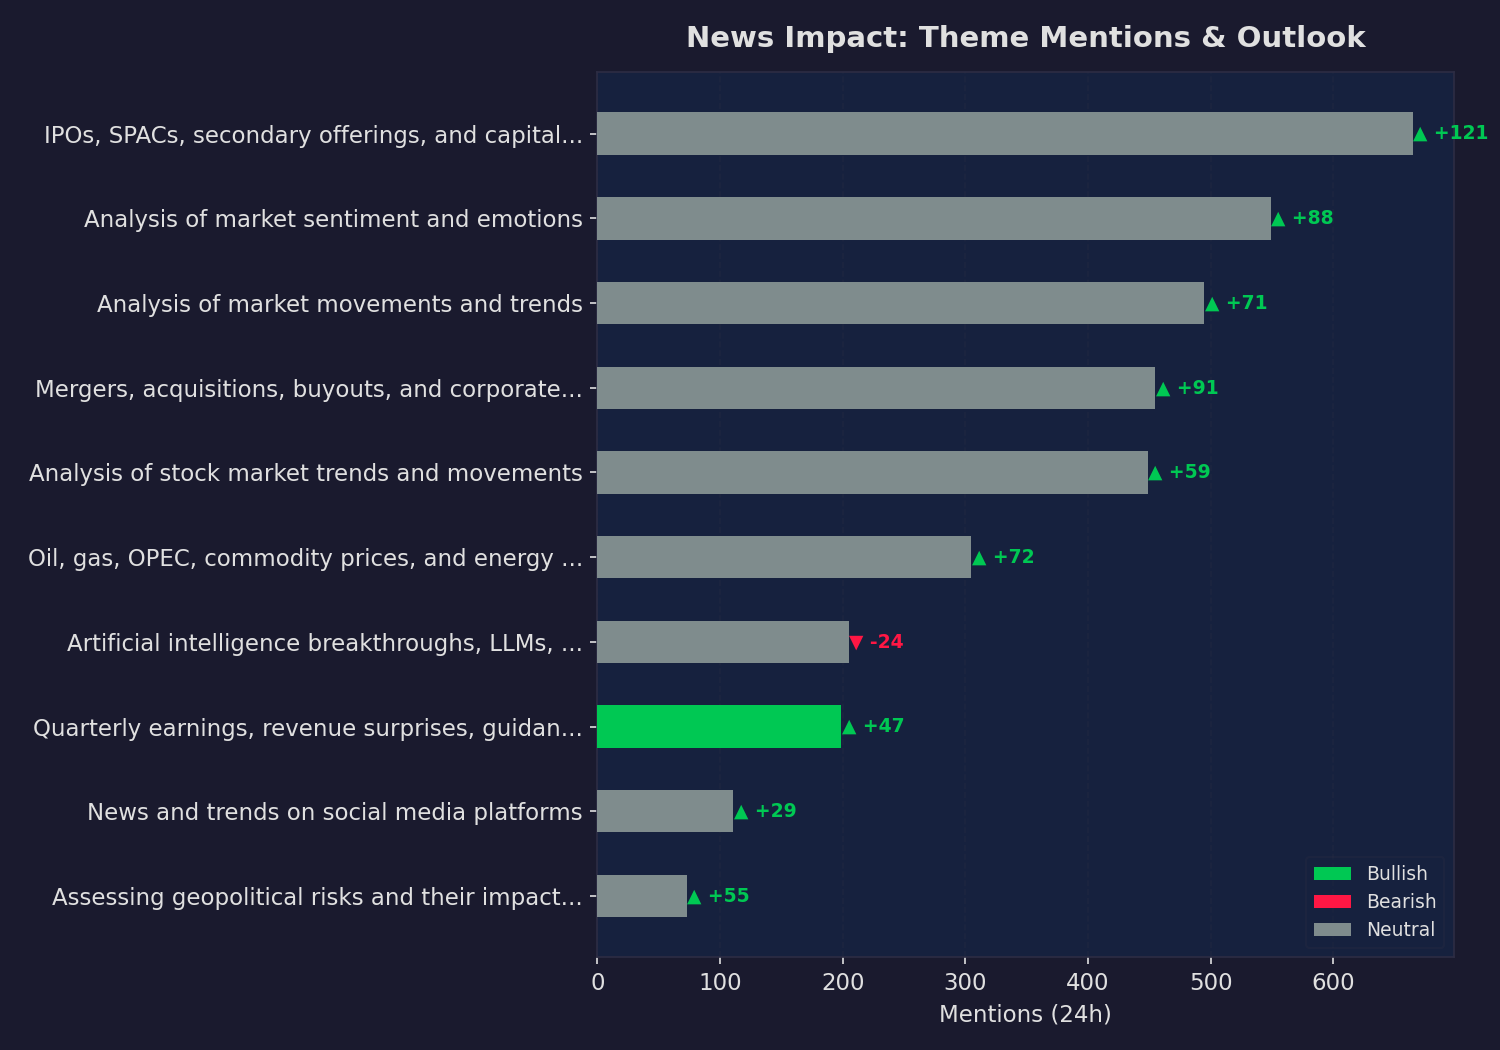
News Impact Classification
Today’s snapshot. Mentions = articles matched in the last 24 hours. Momentum = change vs. the previous 24-hour period.
Supporting Sources
- Li Auto Surges 4% on a $1 Billion Buyback: Is LI or NIO the Better Chinese EV Bet? (Yahoo Finance)
- Asian stocks edge higher as Trump’s 5-day strike postponement eases energy panic (Seeking Alpha Market News)
- Chevron extends winning streak to seventh session (Seeking Alpha Market News)
- CAVA Group stands as the best performing large-cap consumer discretionary stock YTD (Seeking Alpha Market News)
- Software stocks fall as fear of AI disruption is back in full force (MarketWatch Top Stories)
- Short bets in software peak but tension still builds in stocks such as UiPath (CNBC Top News)
- CVS Health rises after six-session losing streak (Seeking Alpha Market News)
- Planet Labs stands as the best performing large-cap industrials stock YTD (Seeking Alpha Market News)
- Li Auto Surges 4% on a $1 Billion Buyback: Is LI or NIO the Better Chinese EV Bet? (Yahoo Finance)
- Asian stocks edge higher as Trump’s 5-day strike postponement eases energy panic (Seeking Alpha Market News)
- Chevron extends winning streak to seventh session (Seeking Alpha Market News)
- CAVA Group stands as the best performing large-cap consumer discretionary stock YTD (Seeking Alpha Market News)
- Short bets in software peak but tension still builds in stocks such as UiPath (CNBC Top News)
- CVS Health rises after six-session losing streak (Seeking Alpha Market News)
- Planet Labs stands as the best performing large-cap industrials stock YTD (Seeking Alpha Market News)
- Asian stocks edge higher as Trump’s 5-day strike postponement eases energy panic (Seeking Alpha Market News)
- Software stocks fall as fear of AI disruption is back in full force (MarketWatch Top Stories)
- 2 Oil Stocks That Can Weather the Current Volatility (Yahoo Finance)
- Small Caps Are Beating Large Caps in 2026. Here Are the 2 ETFs Built to Ride It. (Yahoo Finance)
- Stock market today: Dow, S&P 500, Nasdaq drop after rally as Iran war drags on (Yahoo Finance)
- Want to Buy the Dip on Eli Lilly? Consider This Low-Cost Vanguard ETF (Yahoo Finance)
- How Vanguard Growth ETF Became a Consistent Market-Beater (Yahoo Finance)
- Li Auto Surges 4% on a $1 Billion Buyback: Is LI or NIO the Better Chinese EV Bet? (Yahoo Finance)
- Asian stocks edge higher as Trump’s 5-day strike postponement eases energy panic (Seeking Alpha Market News)
- Chevron extends winning streak to seventh session (Seeking Alpha Market News)
- CAVA Group stands as the best performing large-cap consumer discretionary stock YTD (Seeking Alpha Market News)
- Software stocks fall as fear of AI disruption is back in full force (MarketWatch Top Stories)
- Short bets in software peak but tension still builds in stocks such as UiPath (CNBC Top News)
- CVS Health rises after six-session losing streak (Seeking Alpha Market News)
- 1 AI Stock to Buy Before the Market Realizes Its Mistake (Yahoo Finance)
- GameStop options lean bullish ahead of earnings (Seeking Alpha Market News)
- Jim Cramer Discusses NVIDIA as Its Stock Becomes “Cheaper Than a Paint Company” (Yahoo Finance)
- Jefferies Financial Rallies On Takeover Talk Ahead Of Earnings (Yahoo Finance)
- If You Invested $1,000 in PayPal Stock 10 Years Ago, Here's How Much You'd Have Today (Yahoo Finance)
- Outlook Therapeutics stock slides after pricing $5M offering (Seeking Alpha Market News)
- S4 Capital Shares Jump After Company Reassures on Outlook (Yahoo Finance)
- Asian stocks edge higher as Trump’s 5-day strike postponement eases energy panic (Seeking Alpha Market News)
- 2 Oil Stocks That Can Weather the Current Volatility (Yahoo Finance)
- 5 Stocks to Buy Now That The Strait of Hormuz is Closed (Yahoo Finance)
- Venture Global stands as the best performing large-cap energy stock YTD (Seeking Alpha Market News)
- Sable Offshore is the top performing energy stock in the volatile month of March (Seeking Alpha Market News)
- Stock Market Today: Dow Edges Lower After Rebound; Oil Prices Bounce (Live Coverage) (Yahoo Finance)
- Karman Soars Amid War Turmoil; Nears Buy Point With Earnings Due (Yahoo Finance)
- Bellway Feels Cracks in the Foundation as Rate Shock Hits Demand (Yahoo Finance)
- Tesla finally catches a break in Europe (MarketWatch Top Stories)
- ServiceNow and Salesforce Fall 5%: Is the Market Mispricing Both NOW and CRM? (Yahoo Finance)
- Tesla’s European Sales Finally Increase. The Stock Rises. (Yahoo Finance)
- These Stocks Are Today’s Movers: Tesla, Jefferies, Apollo, Smithfield Foods, Core & Main, Estée… (Yahoo Finance)
- Mattel has big plans tied to the Masters of the Universe movie release (Seeking Alpha Market News)
- Li Auto Surges 4% on a $1 Billion Buyback: Is LI or NIO the Better Chinese EV Bet? (Yahoo Finance)
- Software stocks fall as fear of AI disruption is back in full force (MarketWatch Top Stories)
- Short bets in software peak but tension still builds in stocks such as UiPath (CNBC Top News)
- CVS Health rises after six-session losing streak (Seeking Alpha Market News)
- Altria Group rebound after six-session slide (Seeking Alpha Market News)
- Why ImmunityBio Stock Is Down More Than 20% Today (Yahoo Finance)
- Why The Trade Desk Stock Crashed Again (Yahoo Finance)
Theme History
Long-term theme baselines. Activity shows how the last 30 days of mentions compare to the historical monthly average — e.g. 2.5x means 2.5 times more mentions than usual. Tracked since 2006-03-20 (240 months of data).
| Theme | Total | Avg/Mo | Last 30d | Activity | Sentiment | Peak |
|---|---|---|---|---|---|---|
| Family Financial Planning | 2,255 | 13.3 | 1143 | ▲▲ 85.9x | Neutral | 2026-03 |
| Energy & Commodities | 10,476 | 55.1 | 4268 | ▲▲ 77.5x | Bullish | 2026-03 |
| Presidential Financial News | 3,371 | 19.6 | 1394 | ▲▲ 71.1x | Neutral | 2026-03 |
| War Impact on Industry | 11,953 | 54.6 | 3183 | ▲▲ 58.3x | Neutral | 2026-03 |
| Mergers & Acquisitions | 29,952 | 125.3 | 7164 | ▲▲ 57.2x | Bullish | 2026-03 |
| Regulatory Risk Management | 2,204 | 13.5 | 738 | ▲▲ 54.7x | Bearish | 2026-03 |
| Geopolitical & Trade Tensions | 9,669 | 47.9 | 2617 | ▲▲ 54.6x | Bullish | 2026-03 |
| Market Movement Analysis | 50,443 | 211.9 | 11534 | ▲▲ 54.4x | Neutral | 2026-03 |
| Consumer Spending & Retail | 1,639 | 9.9 | 537 | ▲▲ 54.2x | Neutral | 2026-03 |
| Crypto & Digital Assets | 2,466 | 18.0 | 938 | ▲▲ 52.1x | Neutral | 2026-03 |
| Market Sentiment Analysis | 53,450 | 222.7 | 11294 | ▲▲ 50.7x | Bullish | 2026-03 |
| Stock Market Analysis | 56,619 | 238.9 | 11330 | ▲▲ 47.4x | Bullish | 2026-03 |
| Tax Refund Issues | 1,199 | 7.7 | 359 | ▲▲ 46.6x | Neutral | 2026-03 |
| Sector Rotation | 10,792 | 51.6 | 2363 | ▲▲ 45.8x | Bullish | 2026-03 |
| IPO & Capital Markets | 67,679 | 282.0 | 12782 | ▲▲ 45.3x | Bullish | 2026-03 |
| Earnings Season & Corporate Results | 19,324 | 94.3 | 3920 | ▲▲ 41.6x | Bullish | 2026-03 |
| AI & Technology Innovation | 22,703 | 110.2 | 4532 | ▲▲ 41.1x | Bullish | 2026-03 |
| Labor Market & Employment | 4,604 | 36.8 | 1407 | ▲▲ 38.2x | Neutral | 2026-03 |
| Geopolitical Risk Assessment | 1,122 | 9.1 | 314 | ▲▲ 34.5x | Neutral | 2026-03 |
| Social Media Rebranding | 4,737 | 23.6 | 798 | ▲▲ 33.8x | Neutral | 2026-03 |
| Social Media Buzz | 18,020 | 78.7 | 2428 | ▲▲ 30.9x | Bullish | 2026-03 |
| Regulatory & Antitrust | 9,736 | 52.1 | 1388 | ▲▲ 26.6x | Neutral | 2026-03 |
| Short Selling Strategies | 1,512 | 12.3 | 312 | ▲▲ 25.4x | Bullish | 2026-03 |
| Tax Planning Strategy | 259 | 5.2 | 122 | ▲▲ 23.5x | Neutral | 2026-03 |
| Federal Reserve & Interest Rates | 6,308 | 34.9 | 760 | ▲▲ 21.8x | Bullish | 2026-03 |
| Wall Street Bets Community | 1,893 | 13.3 | 276 | ▲▲ 20.8x | Neutral | 2026-03 |
| Reddit Trading Community | 2,859 | 16.2 | 211 | ▲▲ 13.0x | Neutral | 2026-03 |
| Financial News Interviews | 123 | 1.6 | 20 | ▲▲ 12.5x | Neutral | 2026-03 |
| Social Grants and Consumer Spending | 62 | 2.1 | 25 | ▲▲ 11.9x | Bearish | 2026-03 |
| Apple Financial News | 5,901 | 31.4 | 264 | ▲▲ 8.4x | Bullish | 2025-09 |
| ASIC Miner Market | 1 | 1.0 | 1 | ─ 1.0x | Neutral | 2026-02 |
| Trading Challenge | 9 | 1.8 | 0 | ▼▼ 0.0x | Bearish | 2012-06 |
Activity = last 30 days ÷ monthly avg (e.g. 2.5x = 2.5× more mentions than usual). ▲▲ ≥2x | ▲ ≥1.3x | ─ near avg | ▼ below | ▼▼ <0.3x
This report is for informational purposes only and does not constitute financial advice. Always do your own research before making investment decisions.