Market Overview
SPY fell 1.70% while QQQ dropped 1.85%, with XLF in the green and XLE, XLV, XLK finishing lower. On the watchlist, NVDA was the biggest mover at -3.28%. Tesla (TSLA) took a significant hit today, dropping by 3.24%. This decline can be attributed to a combination of factors, including the company's shift towards AI, which raises questions about China's potential to become a major auto export hub. Additionally, Tesla pushed back expectations for Full Self-Driving (FSD) technology approval by Dutch regulators, potentially delaying European expansion opportunities. Despite these headwinds, Tesla's stock price has been resilient, and its long-term outlook remains positive, with a bullish sentiment of +0.12 over the past 240 months.

Broad Market & Sector ETFs
| Ticker | Close | Change | Change% | Volume |
|---|---|---|---|---|
| QQQ | $582.06 | $10.96 | -1.85% | 89,087,904 |
| SPY | $648.57 | $11.23 | -1.70% | 138,283,514 |
| XLE | $59.31 | $0.05 | -0.08% | 72,682,500 |
| XLF | $49.08 | +$0.09 | +0.18% | 82,438,260 |
| XLK | $135.29 | $3.14 | -2.27% | 22,939,613 |
| XLV | $145.33 | $1.28 | -0.87% | 16,480,960 |

Watchlist Performance
| Ticker | Close | Change | Change% | Volume |
|---|---|---|---|---|
| NVDA | $172.70 | $5.86 | -3.28% | 209,815,684 |
| TSLA | $367.96 | $12.34 | -3.24% | 74,680,129 |
| META | $593.66 | $13.04 | -2.15% | 19,820,750 |
| GOOGL | $301.00 | $6.13 | -2.00% | 44,234,237 |
| MSFT | $381.87 | $7.15 | -1.84% | 46,929,374 |
| AMZN | $205.37 | $3.39 | -1.62% | 55,381,136 |
| AAPL | $247.99 | $0.97 | -0.39% | 87,981,315 |

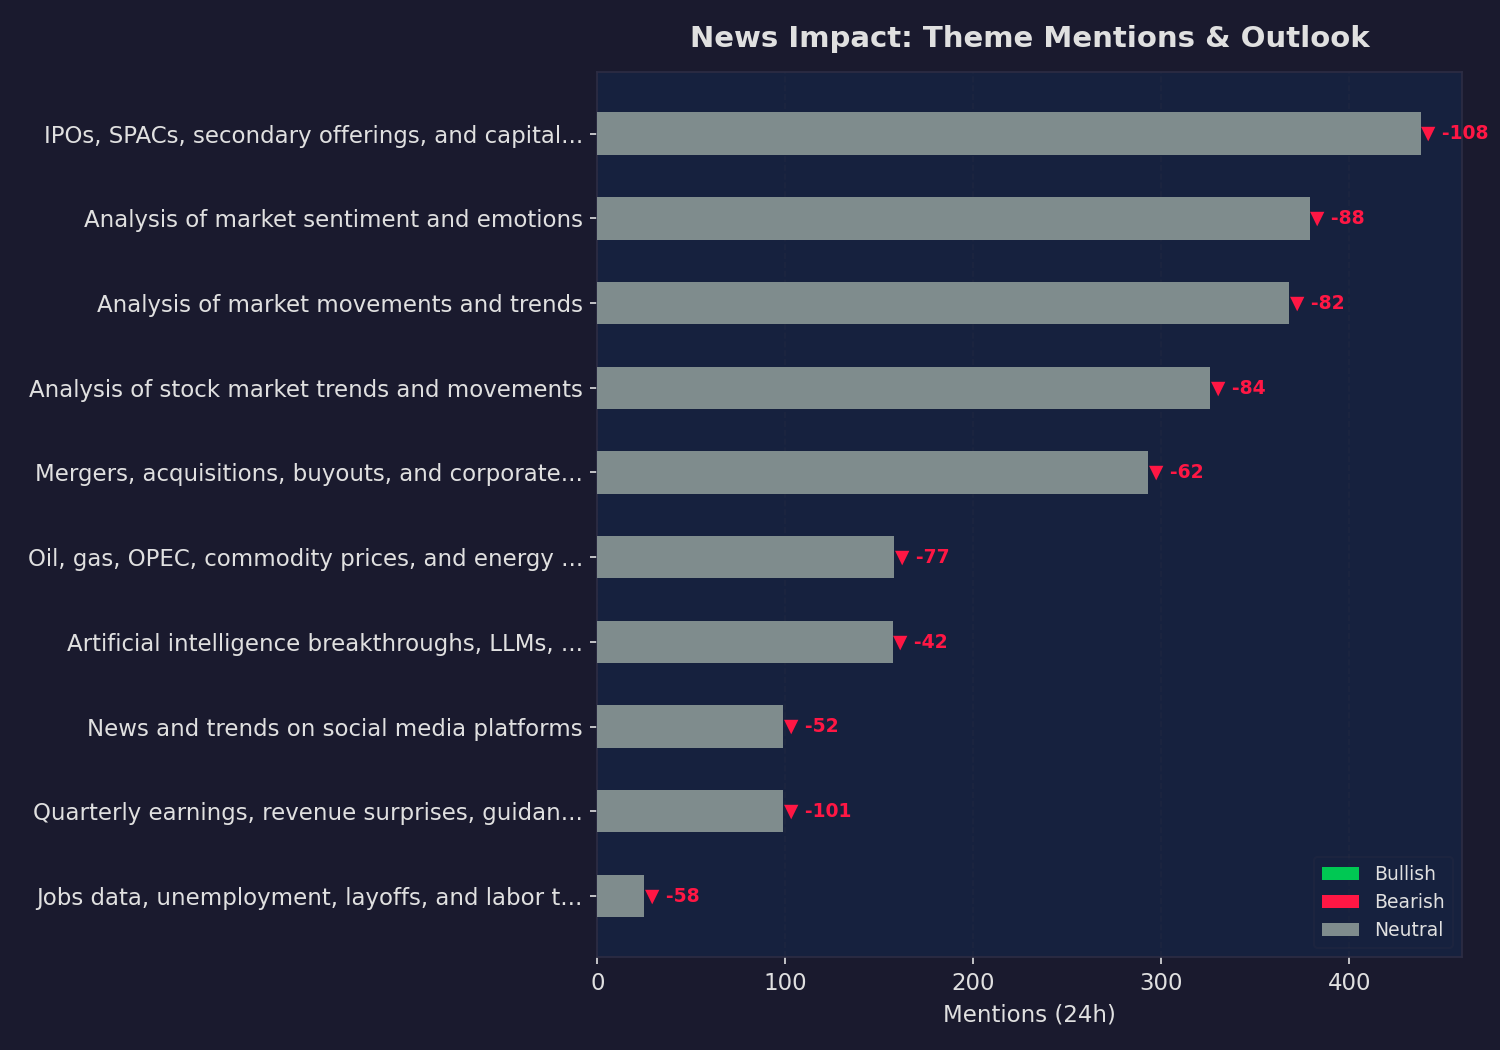
News Impact Classification
Today’s snapshot. Mentions = articles matched in the last 24 hours. Momentum = change vs. the previous 24-hour period.
Supporting Sources
- Nasdaq sinks 2% to a new 6-month trading low (Seeking Alpha Market News)
- Take-Two drops for the seventh straight session (Seeking Alpha Market News)
- Nvidia’s stock chart just displayed a bearish signal. Is the AI star losing its shine? (MarketWatch Top Stories)
- Peacock sees a surge of new subscribers after the Super Bowl and Olympics (Seeking Alpha Market News)
- Stocks making the biggest moves midday: SolarEdge Technologies, Super Micro Computer, FedEx & more (CNBC Top News)
- Why Shares of Super Micro Computer Stock Collapsed This Week (Yahoo Finance)
- Could Buying Visa (V) Today Set You Up for Life? (Yahoo Finance)
- Nasdaq sinks 2% to a new 6-month trading low (Seeking Alpha Market News)
- Russell 2000 enters correction territory, and the Dow, S&P 500, and Nasdaq are not far off (Seeking Alpha Market News)
- Nvidia’s stock chart just displayed a bearish signal. Is the AI star losing its shine? (MarketWatch Top Stories)
- Market Update: KR, ROK, SMCI, LYB (Yahoo Finance)
- Peacock sees a surge of new subscribers after the Super Bowl and Olympics (Seeking Alpha Market News)
- Why Shares of Super Micro Computer Stock Collapsed This Week (Yahoo Finance)
- Could Buying Visa (V) Today Set You Up for Life? (Yahoo Finance)
- Nasdaq sinks 2% to a new 6-month trading low (Seeking Alpha Market News)
- Russell 2000 enters correction territory, and the Dow, S&P 500, and Nasdaq are not far off (Seeking Alpha Market News)
- Take-Two drops for the seventh straight session (Seeking Alpha Market News)
- Nvidia’s stock chart just displayed a bearish signal. Is the AI star losing its shine? (MarketWatch Top Stories)
- Market Update: KR, ROK, SMCI, LYB (Yahoo Finance)
- Peacock sees a surge of new subscribers after the Super Bowl and Olympics (Seeking Alpha Market News)
- Stocks making the biggest moves midday: SolarEdge Technologies, Super Micro Computer, FedEx & more (CNBC Top News)
- Nasdaq sinks 2% to a new 6-month trading low (Seeking Alpha Market News)
- Russell 2000 enters correction territory, and the Dow, S&P 500, and Nasdaq are not far off (Seeking Alpha Market News)
- Nvidia’s stock chart just displayed a bearish signal. Is the AI star losing its shine? (MarketWatch Top Stories)
- Market Update: KR, ROK, SMCI, LYB (Yahoo Finance)
- Peacock sees a surge of new subscribers after the Super Bowl and Olympics (Seeking Alpha Market News)
- Stocks making the biggest moves midday: SolarEdge Technologies, Super Micro Computer, FedEx & more (CNBC Top News)
- Why Shares of Super Micro Computer Stock Collapsed This Week (Yahoo Finance)
- Nvidia’s stock chart just displayed a bearish signal. Is the AI star losing its shine? (MarketWatch Top Stories)
- Stock Market Tumbles On Oil Prices, Surging Yields; Nvidia, Micron Upbeat: Weekly Review (Yahoo Finance)
- XRP Price: Why Is XRP Still Falling When Ripple Keeps Winning? (Yahoo Finance)
- Anheuser-Busch's Michelob Ultra wins St. Patrick's Day again (Seeking Alpha Market News)
- Eric Trump Says 'Up We Go' After American Bitcoin Surpasses Galaxy Digital In Bitcoin Holdings — So… (Yahoo Finance)
- Is NVIDIA Really a “Value Stock” at Under $200? (Yahoo Finance)
- XTL Biopharmaceuticals announces 1-for-4 ADS ratio change (Seeking Alpha Market News)
- U.S. drilling rig count drops for first time in three weeks, Baker Hughes says (Seeking Alpha Market News)
- Peacock sees a surge of new subscribers after the Super Bowl and Olympics (Seeking Alpha Market News)
- Stocks making the biggest moves midday: SolarEdge Technologies, Super Micro Computer, FedEx & more (CNBC Top News)
- Why Shares of Super Micro Computer Stock Collapsed This Week (Yahoo Finance)
- Stock Market Tumbles On Oil Prices, Surging Yields; Nvidia, Micron Upbeat: Weekly Review (Yahoo Finance)
- Jim Cramer Explains Why “Uber Stock Caught Fire Earlier This Week” (Yahoo Finance)
- Nvidia’s stock chart just displayed a bearish signal. Is the AI star losing its shine? (MarketWatch Top Stories)
- Peacock sees a surge of new subscribers after the Super Bowl and Olympics (Seeking Alpha Market News)
- Stock Market Tumbles On Oil Prices, Surging Yields; Nvidia, Micron Upbeat: Weekly Review (Yahoo Finance)
- China’s NIO Inc. (NIO) Seeks Overseas Development, Flagging a Memory Chip Shortage (Yahoo Finance)
- Jim Cramer Explains Why “Uber Stock Caught Fire Earlier This Week” (Yahoo Finance)
- Micron Stock Closes Volatile Week But Still Is Near A Buy Point (Yahoo Finance)
- Vanguard S&P 500 Index ETF declares CAD 0.4239 dividend (Seeking Alpha Market News)
- As Tesla Exits Into AI, Can China Become An Auto Export Capital? (Yahoo Finance)
- Tim Cook’s China visit reinforces country’s importance to Apple as global frictions rise (CNBC Top News)
- Flowco prices 7.8M-share sale at $22 each; plans buyback post-offering (Seeking Alpha Market News)
- Eight states ask judge to temporarily block Nexstar, Tegna integration (Seeking Alpha Market News)
- Super Micro shares plunge on shocking smuggling case. One stock stands to benefit (CNBC Top News)
- Tesla’s push to expand its self-driving technology hits another speed bump (MarketWatch Top Stories)
- Nasdaq sinks 2% to a new 6-month trading low (Seeking Alpha Market News)
- Take-Two drops for the seventh straight session (Seeking Alpha Market News)
- Nvidia’s stock chart just displayed a bearish signal. Is the AI star losing its shine? (MarketWatch Top Stories)
- Stocks making the biggest moves midday: SolarEdge Technologies, Super Micro Computer, FedEx & more (CNBC Top News)
- Stock Market Tumbles On Oil Prices, Surging Yields; Nvidia, Micron Upbeat: Weekly Review (Yahoo Finance)
- Jim Cramer Explains Why “Uber Stock Caught Fire Earlier This Week” (Yahoo Finance)
- Vanguard S&P 500 Index ETF declares CAD 0.4239 dividend (Seeking Alpha Market News)
- Netflix Q1 2026 Preview: The 3 Metrics That Could Move the Stock (Yahoo Finance)
- NGEx Minerals Ltd. GAAP EPS of -C$0.18 (Seeking Alpha Market News)
- Lithium Americas shares drop on fourth quarter earnings miss (Yahoo Finance)
- Bechtle Q4 Earnings Call Highlights (Yahoo Finance)
- RCI Hospitality Q4 Earnings Call Highlights (Yahoo Finance)
- K-Bro Linen Q4 Earnings Call Highlights (Yahoo Finance)
- FedEx Stock Flashes Buy Signal On Earnings. Why Wall Street Is On Board. (Yahoo Finance)
Theme History
Long-term theme baselines. Activity shows how the last 30 days of mentions compare to the historical monthly average — e.g. 2.5x means 2.5 times more mentions than usual. Tracked since 2006-03-20 (240 months of data).
| Theme | Total | Avg/Mo | Last 30d | Activity | Sentiment | Peak |
|---|---|---|---|---|---|---|
| Family Financial Planning | 1,954 | 11.6 | 854 | ▲▲ 73.6x | Neutral | 2026-03 |
| Energy & Commodities | 9,468 | 49.8 | 3298 | ▲▲ 66.2x | Bullish | 2026-03 |
| Presidential Financial News | 3,114 | 18.1 | 1149 | ▲▲ 63.5x | Neutral | 2026-03 |
| War Impact on Industry | 11,397 | 52.0 | 2672 | ▲▲ 51.4x | Neutral | 2026-03 |
| Market Movement Analysis | 48,340 | 203.1 | 9649 | ▲▲ 47.5x | Bullish | 2026-03 |
| Mergers & Acquisitions | 28,262 | 118.3 | 5605 | ▲▲ 47.4x | Bullish | 2026-03 |
| Consumer Spending & Retail | 1,525 | 9.2 | 429 | ▲▲ 46.6x | Neutral | 2026-03 |
| Geopolitical & Trade Tensions | 9,095 | 45.0 | 2080 | ▲▲ 46.2x | Bullish | 2026-03 |
| Regulatory Risk Management | 2,034 | 12.5 | 576 | ▲▲ 46.1x | Bearish | 2026-03 |
| Crypto & Digital Assets | 2,232 | 16.3 | 711 | ▲▲ 43.6x | Neutral | 2026-03 |
| Market Sentiment Analysis | 51,138 | 213.1 | 9196 | ▲▲ 43.1x | Bullish | 2026-03 |
| Stock Market Analysis | 54,626 | 230.5 | 9616 | ▲▲ 41.7x | Bullish | 2026-03 |
| Tax Refund Issues | 1,134 | 7.3 | 296 | ▲▲ 40.5x | Neutral | 2026-03 |
| Sector Rotation | 10,376 | 49.6 | 1984 | ▲▲ 40.0x | Bullish | 2026-03 |
| IPO & Capital Markets | 65,030 | 271.0 | 10457 | ▲▲ 38.6x | Bullish | 2026-03 |
| Earnings Season & Corporate Results | 18,579 | 90.6 | 3251 | ▲▲ 35.9x | Bullish | 2026-03 |
| AI & Technology Innovation | 21,672 | 105.2 | 3617 | ▲▲ 34.4x | Bullish | 2026-03 |
| Labor Market & Employment | 4,388 | 35.1 | 1200 | ▲▲ 34.2x | Neutral | 2026-03 |
| Social Media Rebranding | 4,564 | 22.7 | 634 | ▲▲ 27.9x | Neutral | 2026-03 |
| Social Media Buzz | 17,599 | 76.9 | 2080 | ▲▲ 27.1x | Bullish | 2026-03 |
| Regulatory & Antitrust | 9,429 | 50.4 | 1180 | ▲▲ 23.4x | Neutral | 2026-03 |
| Geopolitical Risk Assessment | 995 | 8.1 | 189 | ▲▲ 23.3x | Neutral | 2026-03 |
| Short Selling Strategies | 1,437 | 11.7 | 244 | ▲▲ 20.9x | Bullish | 2026-03 |
| Tax Planning Strategy | 218 | 4.4 | 86 | ▲▲ 19.6x | Neutral | 2026-03 |
| Wall Street Bets Community | 1,865 | 13.1 | 254 | ▲▲ 19.4x | Neutral | 2026-03 |
| Federal Reserve & Interest Rates | 6,160 | 34.0 | 657 | ▲▲ 19.3x | Bullish | 2026-03 |
| Reddit Trading Community | 2,851 | 16.2 | 204 | ▲▲ 12.6x | Neutral | 2026-03 |
| Social Grants and Consumer Spending | 60 | 2.0 | 23 | ▲▲ 11.5x | Bearish | 2026-03 |
| Financial News Interviews | 119 | 1.6 | 16 | ▲▲ 10.0x | Neutral | 2026-03 |
| Apple Financial News | 5,835 | 31.0 | 247 | ▲▲ 8.0x | Bullish | 2025-09 |
| ASIC Miner Market | 1 | 1.0 | 1 | ─ 1.0x | Neutral | 2026-02 |
| Trading Challenge | 9 | 1.8 | 0 | ▼▼ 0.0x | Bearish | 2012-06 |
Activity = last 30 days ÷ monthly avg (e.g. 2.5x = 2.5× more mentions than usual). ▲▲ ≥2x | ▲ ≥1.3x | ─ near avg | ▼ below | ▼▼ <0.3x
This report is for informational purposes only and does not constitute financial advice. Always do your own research before making investment decisions.